Contamination analysis is all about detecting unwanted materials on or inside a product, whether visible or microscopic. Even small traces of contamination can compromise performance or, in some cases, pose serious safety risks.
Physically small contaminants that are difficult to isolate from the product can be non-destructively characterized in place using FTIR microscopy. This method combines magnification and image capture from visual microscopy with the ability to identify unknown materials using infrared spectra.
The first step is always to identify the contaminants involved, whether the application involves pharmaceuticals, food, plastics, or electronic parts. This information enables the contamination source to be determined and helps prevent future occurrences.
FTIR microscopy is a robust analytical method used to identify contaminants at specific locations within a sample. By using visual imaging to pinpoint the exact location of contamination, an infrared spectrum can be collected from the targeted area, enabling precise identification of the contaminant.
This approach is most effective for samples with a limited number of contaminant spots, as each location must be manually selected and individually analyzed.
Alternatively, FTIR microscopy can utilize mapping to generate a detailed image of the sample area. In this mapping approach, infrared spectra are systematically gathered across a predefined region, producing comprehensive infrared images that reveal the distribution of different components or contaminants.
The mapping method is particularly useful for detecting impurities that are visually difficult to locate and for identifying multiple contaminant types dispersed throughout the sample.
While FTIR imaging provides a more comprehensive analysis than single-point analysis, it also requires more time. Accordingly, the choice between single-point analysis and mapping should be based on the specific requirements of the analysis.
This study presents the results of an analysis of multiple silicon drift detector (SDD) elements to demonstrate the application of FTIR imaging in contaminant analysis.
A silicon drift detector measures X-ray energy as part of an energy-dispersive spectroscopy system used in electron microscopy analysis.
When analyses are conducted on an SEM (scanning electron microscope) or TEM (transmission electron microscope), X-rays are produced when the electron beam causes the ejection of an inner orbital electron from the sample, and an outer orbital electron moves down to take its place.
Each emitted X-ray carries a unique energy signature linked to a specific element in the sample. A silicon drift detector (SDD) captures this energy, allowing precise identification of the sample’s elemental composition.
Contamination of an SDD can occur either outside the SEM or within the instrument itself. A vacuum environment is maintained within the SEM, with the surface of the SDD exposed to this environment.
This presents several potential contamination sources, including the pumping system, O-rings and other seals, and degassing from samples. Identifying the contaminants is necessary to trace their origin and prevent future contamination.
Experimental
The data presented in this study was acquired using a Thermo Scientific™ Nicolet™ iN10 MX Infrared Microscope.
Almost the entire surface area of the SDD detector was imaged using a liquid-nitrogen-cooled linear-array detector with a 25-micron pixel size and 16 scans per spectrum.
The spectra were gathered in reflection mode from the surface of the detector element.
Results
The visual image of the SDD detector element surface is displayed in Figure 1. The contamination is readily observable and spreads across the surface. The imaged area, indicated by the red rectangle, is 10,500 x 5,625 μm2.
The infrared images depicted in Figure 2 (a, b, and c) were produced from different aspects (peak areas and correlation) of the 95,146 spectra that comprise the imaging data set. These images illustrate the spatial distribution of three distinct contaminant types.
In the infrared images, colors range from blue to red, with blue representing low/no intensity or correlation, red representing the highest intensity or correlation, and other colors representing values between these.
As the images are based on the spectral characteristics of the contaminants, they illustrate their spatial distribution. Figure 2 also includes spectra corresponding to the contaminants corresponding to each image.
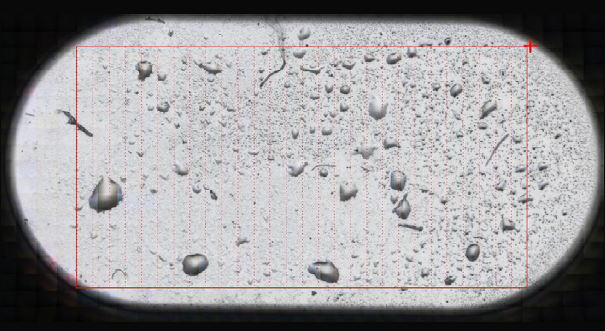
Figure 1. Visual mosaic image of the first contaminated SDD collected with the iN10 MX. The red rectangle indicates the area (10,500 μm x 5,625 μm) designated for FTIR imaging (see Figure 2). Image Credit: Thermo Fisher Scientific - Vibrational Spectroscopy
Spectrum 2a is consistent with long-chain hydrocarbon oil, e.g., mineral oil. Mineral oil is used in a wide range of products and can be used by itself or as a base for blended oils.
Spectrum 2b is also likely an oil, but contains additional components or additives. It is consistent with hydraulic and gear oils, which include additives to reduce wear.
This oil appears to contain a type of ester additive, as indicated by the additional spectral peaks. Another possible source of an ester, such as a terephthalate, could be plasticizers used in components such as O-rings.
The third type of contaminant (Spectrum 2c) is consistent with cellulose and appears as small fibers and particles.
Since the SDD is utilized in a vacuum environment within an SEM, the oil contamination could have originated from the vacuum system. However, tracing the contamination back to the source is a later step and will not be addressed in this study.
The cellulose may originate from textiles; the oil on the surface could cause cellulose particles to adhere when they might otherwise not be retained.
The infrared images in Figure 2 provide further insight by showing the distribution of contaminants across the SDD surface. The contaminant depicted in Figure 2b appears as discrete particles or droplets, whereas the contaminant in Figure 2a is spread out more evenly across the surface.
Particle or droplet size can be measured manually, but this approach becomes tedious when large numbers of features are present. To facilitate this distribution analysis, an image analysis can be conducted to obtain size and shape information on all the properties.
Image analysis of the infrared image illustrated in Figure 2b detected 65 droplets with areas ranging from 3,750 to 45,1870 μm2. Assuming the droplets are approximately circular, this corresponds to diameters ranging from 69 to 758 μm. Figure 3 presents a plot of the size distribution of the droplets shown in Figure 2b.
The number of cellulose particles in Figure 2c does not require a similarly comprehensive image analysis. However, the image clearly depicts both cellulose fibers and particles. The presence of cellulose fibers may provide clues about the source.
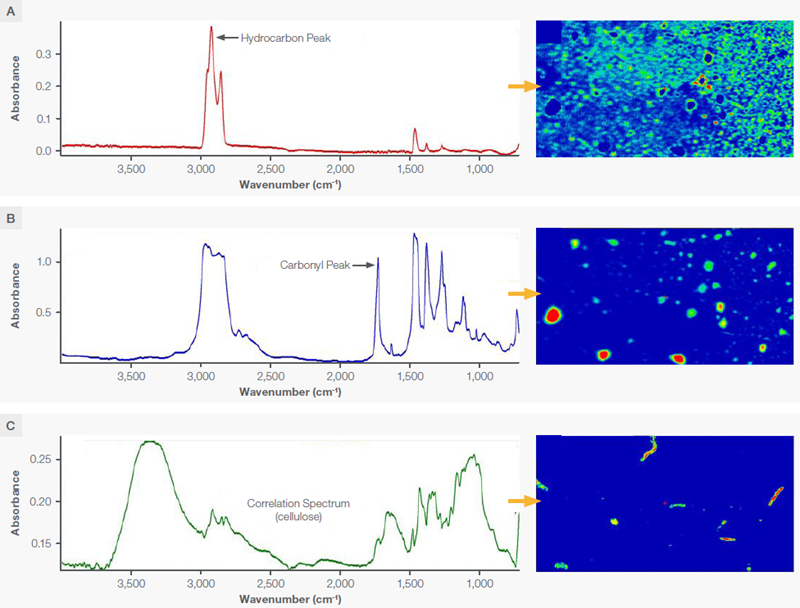
Figure 2. False color infrared images of the area on the first contaminated SDD (see Figure 1). The colors represent peak intensities (A,B) or degree of correlation (C) and range from blue, where the values are lowest, through green and yellow, and finally to red, where the values are the highest. (A) An infrared image based on the peak area (2931-2881 cm-1) of the hydrocarbon oil spectrum shown adjacent to the image; (B) An infrared image based on the ester carbonyl peak area (1771-1684 cm-1) shown in the corresponding spectrum; (C) The infrared image based on a correlation to the spectrum of cellulose from the sample shown in the adjoining spectrum. Image Credit: Thermo Fisher Scientific - Vibrational Spectroscopy
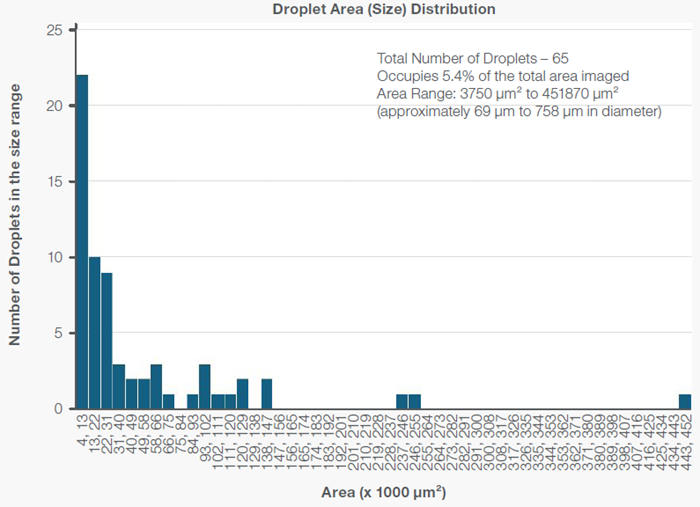
Figure 3. Histogram of the size distribution (areas) of the oil droplets shown in infrared image 2b. Image Credit: Thermo Fisher Scientific - Vibrational Spectroscopy
Figure 4 presents a second example. The visual image illustrates more finely dispersed contamination across most of the surface, except for the central area of the SDD. FTIR imaging of the region defined by the red rectangle (9,375 x 5,850 μm2) yields results akin to the previous sample (see Figure 5).
Although contaminated by similar materials, the distribution and relative amounts differ.
Most of the well-dispersed contamination appears to be mineral oil, while the amount of ester-containing oil is much lower (31 droplets, diameters 41-360 μm, 0.63% of the total area). Although some small (29-114 μm diameter) cellulose particles are visible, their amounts are lower than in the first sample and contain no clear fibers.
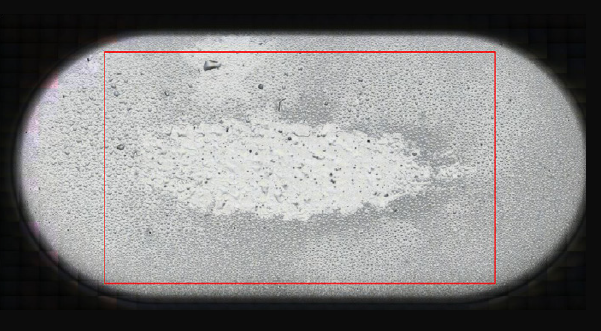
Figure 4. Visual mosaic image of the second contaminated SDD collected with the iN10 MX. The red rectangle indicates the area (9375 x 5850 μm2) selected for FTIR imaging (see Figure 5). Image Credit: Thermo Fisher Scientific - Vibrational Spectroscopy
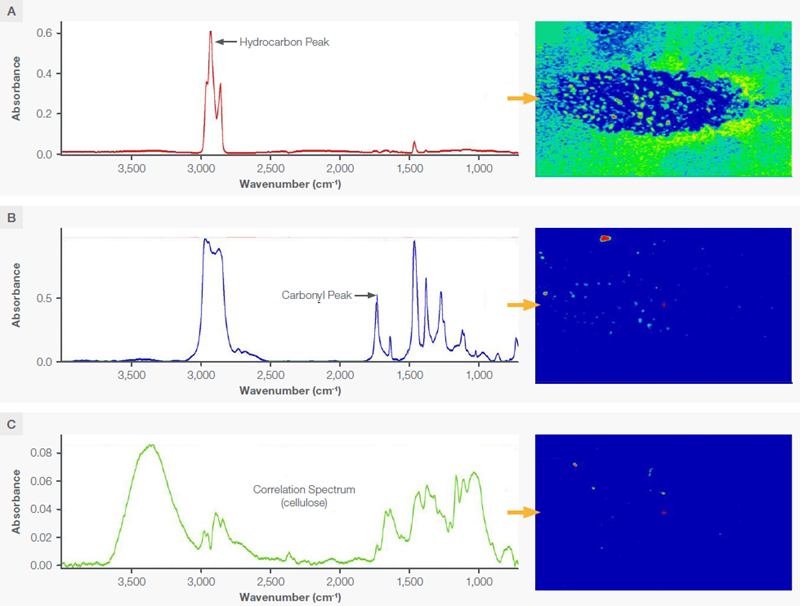
Figure 5. False color infrared images of the area on the second contaminated SDD. The colors represent peak intensities (A, B) or degree of correlation (C) and range from blue, where the values are lowest, through green and yellow, and finally to red, where the values are the highest. (A) An infrared image based on the peak area (2931-2881 cm-1) of the hydrocarbon oil spectrum shown adjacent to the image; (B) An infrared image based on the ester carbonyl peak area (1771-1684 cm-1) shown in the corresponding spectrum; (C) The infrared image based on a correlation to the spectrum of cellulose from the sample shown in the adjoining spectrum. Image Credit: Thermo Fisher Scientific - Vibrational Spectroscopy
The final example is a relatively clean SDD (Figure 6) and is included mainly for reference. The visible image reveals only a few particles, and the infrared images largely exhibit minimal contamination. Spectrum 7a is consistent with protein spectra, although only a few (11) small (30-110 μm diameter) particles are visible.
Small protein particles from biological sources are widespread in the environment. Spectrum 7b is consistent with a copolymer containing polyvinyl chloride, potentially originating from materials such as plastic wrap.
The amount of this contaminant is also quite low (nine particles, 32-135 μm in diameter). No evidence of oil contamination was detected on this SDD.
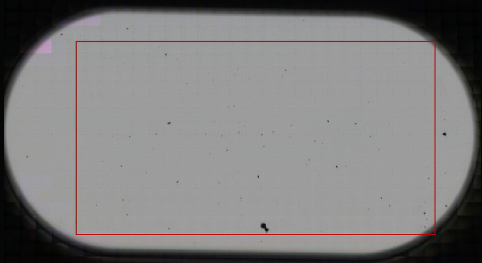
Figure 6. Visual mosaic image of the third (mostly clean) SDD collected with the iN10 MX. The red rectangle indicates the area (10500 x 5250 μm2) selected for FTIR imaging (see Figure 7). Image Credit: Thermo Fisher Scientific - Vibrational Spectroscopy
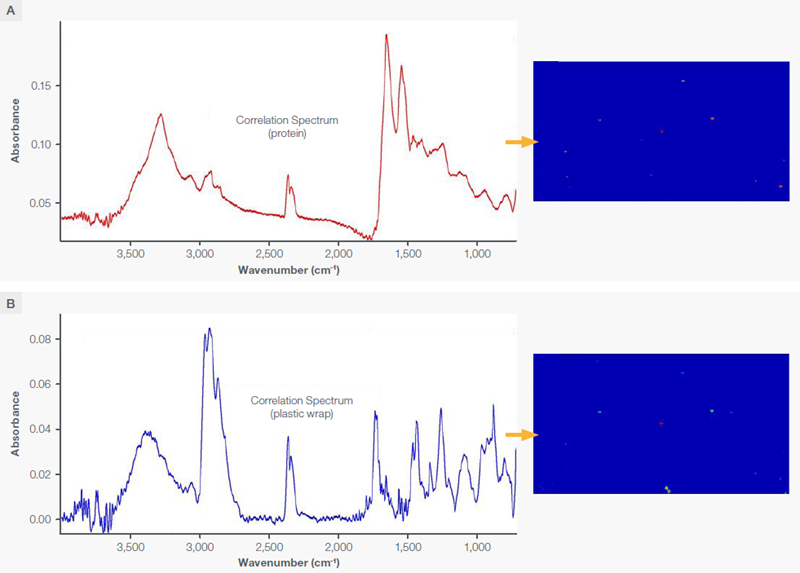
Figure 7. False color infrared images of the area on the third (mostly clean) SDD (see Figure 6). The colors represent the degree of correlation to the associated spectra and range from blue, where the values are lowest, through green and yellow, and finally to red, where the values are the highest. (A) An infrared image based on the correlation to the protein spectrum from the sample shown adjacent to the image, (B) An infrared image based on the correlation to the adjoining spectrum from a plastic particle on the sample. Image Credit: Thermo Fisher Scientific - Vibrational Spectroscopy
The surfaces of the first two SDDs exhibited significant contamination. While some foreign material, such as cellulose, may have resulted from device handling and shipping, the oil contamination clearly did not originate from these sources.
The relatively small amount of foreign material on the third SDD is more representative of what might be expected from exposure to possible environmental contaminants outside the SEM.
Although hydrocarbon contamination can occur within an SEM due to factors such as sample and component outgassing or the conveyance of contaminants through the vacuum pump, these samples showed a substantial amount of oil. This indicates a significant problem that must be addressed.
Conclusion
The examples presented in this study illustrate the first step in contamination analysis: identifying foreign materials so they can be traced back to their source.
FTIR microscopy may also play an additional role later in confirming a link between the source and the observed contamination, but the accomplishment of this critical first step has been demonstrated here.
The first two samples exhibited significant contamination, but the analysis of the largely clean SDD revealed that even just a few small particulates can be identified. Infrared images reveal the spatial distribution of contaminants and provide information about their size and shape.
This general strategy can also be applied to other sample types. The iN10 MX Infrared Microscope features exceptional optics that deliver an excellent infrared signal. When combined with the linear array detector, it enables efficient imaging of sample areas where contaminants are located and identified, while also showing their distribution across the sample.

This information has been sourced, reviewed, and adapted from materials provided by Thermo Fisher Scientific - Vibrational Spectroscopy.
For more information on this source, please visit Thermo Fisher Scientific - Vibrational Spectroscopy.