Sponsored by DandeLiionReviewed by Olivia FrostAug 6 2026
This article is based on a poster originally authored by Ivan Korotkin, Giles Richardson, M. Waseem Marzook, Matheus Leal de Souza, and Monica Marinescu.
This article presents a scalable, physics-based simulation framework for arbitrary MsNp lithium-ion battery pack configurations. The simulation framework is demonstrated on a representative 4s4p pack with bottom cooling and verified against experiments conducted on a similar device.
This new approach models each cell as a set of spatially resolved finite sections, each governed by the full Doyle-Fuller-Newman (DFN) equations, and couples all sections thermally and electrically, resulting in a network of over 80 simultaneous DFN models for the 4s4p case.
This enables detailed prediction of intra-pack thermal and electrochemical behavior, capturing the effects of cell imbalance and thermal management strategies in EV battery packs for safer, more reliable, and longer-lasting electric vehicles.
Motivation
- The rapid adoption of electric vehicles worldwide has intensified the need for advanced Li-ion battery pack simulation tools that can:
- Accelerate design
- Reduce prototyping costs
- Ensure safety
- Increase longevity
- A key challenge in battery pack engineering is the accurate prediction of temperature distributions, as non-uniform thermal gradients lead to cell-to-cell performance differences, inhomogeneous degradation,4 reduced pack capacity, and potential safety hazards.
Experiment and Model
- The 4s4p battery pack (Fig. 1) consists of four groups of cells connected in series, where each group contains four cells connected in parallel, resulting in a total of 16 cells in the pack. On each cell, thermal data is collected from the positive cap on top of the cell, from the base of the cell, and from three points distributed along the length of the cell can, including the middle point.
- The cells in the pack are arranged in a hexagonal pattern, forming a grid where each cell is surrounded by up to six others in a honeycomb-like structure. To account for temperature variations throughout each cell, individual cells are divided into five equal horizontal sections (Figures 3-4). Each cell section is described by a full Newman model with a single time-dependent temperature (parameterized according to references 2 and 3).
- There are five distinct thermal pathways through which heat is exchanged. These pathways are illustrated in Figure 2, in which each cylinder represents a cell section, and the arrows show possible heat exchange paths.
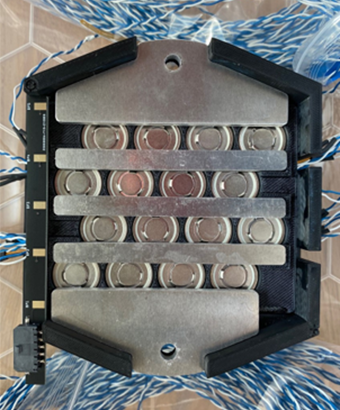
Fig 1. 4s4p pack, top view. Image Credit: DandeLiion
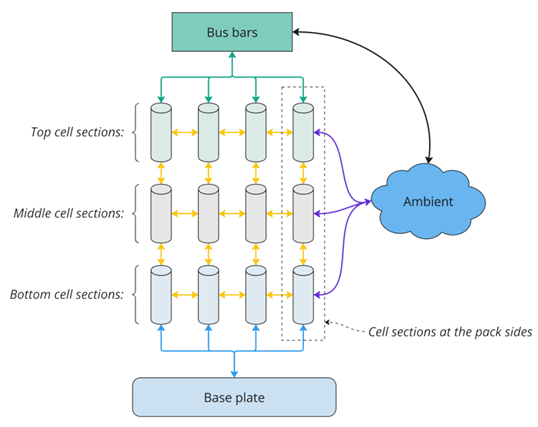
Fig 2. Thermal coupling between the cells and possible thermal pathways. Each cylinder represents one individual cell section. Image Credit: DandeLiion
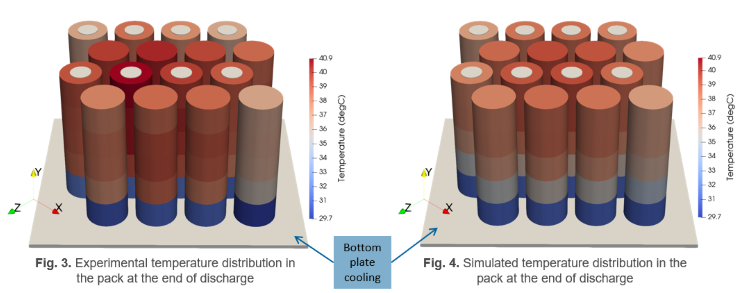
Fig 3. Experimental temperature distribution in the pack at the end of discharge; Fig 4. Simulated temperature distribution in the pack at the end of discharge. Image Credit: DandeLiion
Parameter Fitting and Simulation Results
- Heat exchange parameters were calibrated using the experimental temperature distribution at different points in the pack. The pack was discharged at 1C for 30 minutes, followed by a rapid charge-discharge cycle (0.5 seconds at 1C discharge, then 0.5 seconds at 1C charge, repeated for two hours), as shown in Figure 5. The thermal model accounts for heat of mixing as described in reference 1.
- If heat of mixing is excluded, the model fails to reproduce the experimental temperature profile (Figure 6).
- The parameters fitted to the cycle in Figure 5 were then applied to a different test profile (10 pulses of six minutes at 1C, each followed by 10 minutes of rest). The model accurately reproduced the experimental results (Figure 7).
- The pack’s total voltage compared to the experiment is shown in Figure 8.
- Note: The hottest point is located at the top center of the pack, the medium point at a corner, and the coldest point at the bottom.
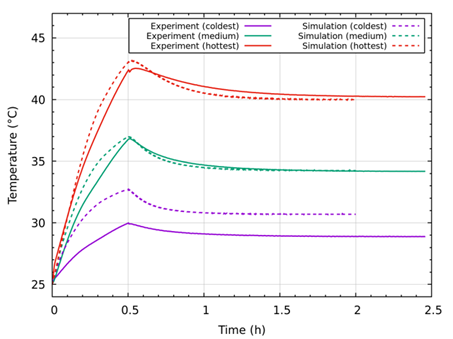
Fig 5. Temperature distribution vs time at three different points in the pack after parameter fitting. The thermal model includes heat of mixing as in reference 1. Image Credit: Richardson, G. and Korotkin, I. (2021)1
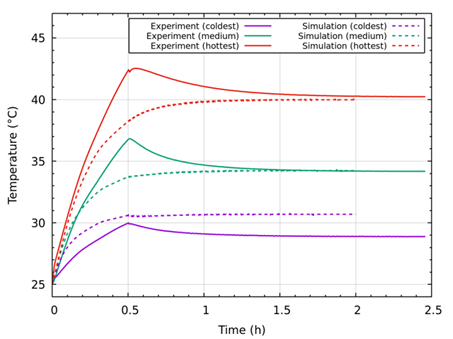
Fig 6. Temperature distribution vs time at three different points in the pack (same parameters as in Figure 5). The thermal model without heat of mixing. Image Credit: DandeLiion
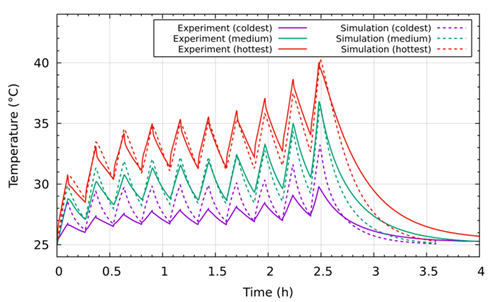
Fig 7. Temperature vs time at three different points in the pack (same parameters as in Figure 5), experiment vs simulation. Image Credit: DandeLiion
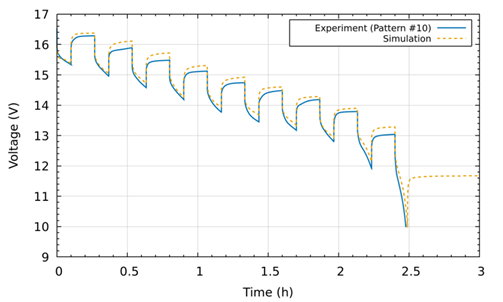
Fig 8. Total voltage of the pack vs time, experiment vs simulation. Experiment with 10 six-minute 1C pulses and 10-minute relaxation. Image Credit: DandeLiion
Conclusion
- The temperature distribution inside the pack has been successfully simulated using a fully coupled (thermally and electrically) physics-based electrochemical model.
- The model shows very high accuracy when compared with experimental measurements (±1 °C).
- The model is implemented in a general framework: cell neighbors are defined via a neighbor list, allowing cells to be divided into sections and arranged in arbitrary MsNp configurations.
- The model is licensed to About:Energy, the commercial partner of DandeLiion, and is accessible in the Cloud through a convenient Python API.
- Full discharge simulation takes around a minute.
- The results highlight the importance of including heat of mixing (as described in reference 1) in the heat source terms.
References
- Richardson, G. and Korotkin, I. (2021). Heat generation and a conservation law for chemical energy in Li-ion batteries. Electrochimica Acta, 392, p.138909. DOI:10.1016/j.electacta.2021.138909. https://www.sciencedirect.com/science/article/abs/pii/S0013468621011993.
- Chen, C.-H., et al. (2020). Development of Experimental Techniques for Parameterization of Multi-scale Lithium-ion Battery Models. Journal of The Electrochemical Society, 167(8), p.080534. DOI:10.1149/1945-7111/ab9050. https://iopscience.iop.org/article/10.1149/1945-7111/ab9050/meta.
- O’Regan, K., et al. (2022). Thermal-electrochemical parameters of a high energy lithium-ion cylindrical battery. Electrochimica Acta, 425, p.140700. DOI:10.1016/j.electacta.2022.140700. https://www.sciencedirect.com/science/article/abs/pii/S0013468622008593?via%3Dihub.
- Li, S., et al. (2023). Effect of thermal gradients on inhomogeneous degradation in lithium-ion batteries. Communications Engineering, 2(1). DOI:10.1038/s44172-023-00124-w. https://www.nature.com/articles/s44172-023-00124-w.

This information has been sourced, reviewed, and adapted from materials provided by DandeLiion.
For more information on this source, please visit DandeLiion.