Sponsored by VeecoMar 12 2006
Microscopic evaluation is important for the design and evaluation of a pharmaceutical product after the steps in the drug formulation process. Since atomic force microscopy (AFM) provides the ability to directly investigate surface structure at nanometer-to-subangstrom resolution in ambient and liquid environments, it has been applied to a wide range of pharmaceutical research, and delivers a powerful complement to other common analytical techniques.
This application note describes the use of AFM from the studies of drug crystal growth, particle characterization, and tablet coatings in the manufacture of solid dosage forms.
AFM Methods Used For Pharmaceutical Research
AFM is performed by scanning a sharp tip on the end of a flexible cantilever across a sample surface, while maintaining a small, constant force. Tip types vary depending on application requirements, but they typically have an end radius of 5 to 10 nanometers. In a basic AFM setup, a piezoelectric tube scanner scans the tip in a raster pattern over the sample. Tip-sample interaction is monitored by reflecting a laser off the back of the cantilever onto a split-photodiode detector.
Over the past several decades, a variety of scanning modes have been developed to control how the tip scans the sample. Contact mode and TappingMode™ are two of the more commonly used AFM techniques of operation.
Contact Mode
In contact mode AFM, a constant cantilever deflection is maintained by a feedback loop that moves the scanner vertically (Z) at each lateral (X,Y) data point to form the topographic image. By maintaining a constant deflection during scanning, a constant vertical force is maintained between the tip and sample. Applied forces during imaging typically range between 0.1 and 100 nanonewtons. Although contact mode has proven useful for a wide range of applications, it sometimes has difficulty on relatively soft samples.
TappingMode
TappingMode AFM consists of oscillating the cantilever at its resonance frequency (typically about 300 kilohertz) and scanning across the surface with a constant, damped amplitude. The feedback loop maintains a constant root-mean-square (RMS) amplitude by moving the scanner vertically during scanning, which correspondingly maintains a constant applied force to form a topographic image. The main advantage of TappingMode is that it typically operates with a lower vertical force than contact mode, and it eliminates the lateral, shear forces that can damage some samples.
Imaging Soft, Fragile, Adhesive and Particulate Surfaces
Thus, TappingMode has become the preferred technique for imaging soft, fragile, adhesive, and particulate surfaces. Although the initial use of AFM was to produce high-resolution topographic images, a number of related techniques have been developed to study the physical and material properties of sample surfaces, resulting in the field of scanning probe microscopy (SPM). For example, PhaseImaging™ consists of mapping the phase lag of the oscillating cantilever with respect to the drive signal during TappingMode imaging. This produces a topographic image along with a phase map that can differentiate areas based on viscoelasticity, adhesion, hydrophobicity, and other properties.
Crystal Growth
Therapeutic agents are commonly formed into crystalline forms for drug delivery. Three-dimensional surface morphology and crystal structure have a dramatic effect on the manufacture, ease of delivery, bioavailability, dissolution rate, and efficacy of crystalline drug forms. To tailor the growth process to fit desired behavior, growth parameters such as temperature, pH, concentration, and additive levels need to be optimized. In situ visualization of crystallization has been conducted by AFM to optimize the growth conditions in producing a desired morphology, as well as to study growth mechanisms and defect formation.
For example, researchers Yip and Ward have used AFM to study in situ crystallization characteristics of several insulin forms: bovine insulin, LysB28ProB29 insulin, ultralente insulin, and insulin-protamine complexes. Due to the low forces needed to image the insulin surface, they used TappingMode imaging directly in the crystallization liquor. Figure 1 shows the epitaxial growth of a screw dislocation that was observed over 11 hours on LysB28ProB29 insulin.

Figure 1. In situ TappingMode AFM imaging of the (001) plane of LysB28ProB29 insulin during crystal growth. The imaging area is centered around a screw dislocation that completes one rotation over an 11 hour period. Images were acquired at 1 = 0, 2 = 3605, 3 = 7210, 4 = 10,815, 5 = 18,025, and 6 = 40,590 seconds. In 1–3, a defect (marked 1) intentionally formed by the tip is repaired within 120 minutes. In 4–6, an insulin aggregate forms a void that is not incorporated into the growing terraces. 5μm scans. Images courtesy of C. Yip, University of Toronto.
The terraces measure approximately 30 angstroms in height, which is consistent with the c-axis spacing of the insulin hexamer of rhombohedral LysB28ProB29 insulin. Observing the crystallization behavior in situ made it possible to determine growth rates and observe defect formation in real-time. Step advancement was observed to occur at 2 x 10⁻⁶ micrometers per second, which corresponds to the attachment of approximately five unit cells (15 LysB28ProB29 hexamers) per second.
Defects appeared to be caused by large insulin aggregates that were unable to align properly with the crystal structure due to poor mobility, thus forming dislocations and voids in the growing terraces.
These observations were conducted to study differences in growth characteristics between LysB28ProB29 insulin and wild-type porcine/bovine insulin. LysB28ProB29 insulin differs from wild-type porcine/bovine insulins due to a sequence inversion at the C-terminus in the B-chain. This sequence inversion was designed to reduce the insulin monomer association for better dissolution properties. However, the sequence inversion also produced differences in crystallization behavior, as observed by AFM. LysB28ProB29 insulin was shown to have smaller attachment energies (_Gk), more rounded screw dislocations, larger terrace widths, and more persistent vacancies in the (001) plane. These differences can have significant influence on the crystal quality and on its behavior as a therapeutic agent.
Polymorphism
The ability of a drug substance to form into more than one crystalline form is called polymorphism. Different polymorphs possess different physicochemical properties, which affect solubility, dissolution, adsorption, melting point, and stability. Thus, polymorphic characterization is an important parameter in maintaining high product quality and reproducibility in the pharmaceutical industry.
In Yip and Ward’s study on insulin discussed above, the polymorphic forms of insulin were identified by using the AFM to map the crystal structure by imaging the molecular lattice spacings in all three dimensions. At the University of Nottingham, Danesh and coworkers used the advanced PhaseImaging technique to identify and map the distribution of polymorphs of the drug cimetidine.
Force-interaction studies (amplitude-phase distance relationships) were then conducted to identify the polymorphs based on differences in hydrophobicity. In figure 2, cimetidine polymorphs A and B are not easily distinguished in the topographic image, but their distribution is easily characterized in the phase image. The contrast in the phase images is most likely due to the differences in hydrophobicity between the polymorphs, which produces a difference in the tip-sample interaction due to variations in capillary force. This contrast was investigated by conducting the experiment with hydrophilic (plasmaetched) and hydrophobic (alkylsilane) functionalized probes.

Figure 2. Distribution of polymorphic forms A and B of the drug cimetidine conducted by PhaseImaging with hydrophilic probes. The phase image (right) shows the distribution of the A (dark) and B (light) polymorphs that is not evident in the topographic TappingMode image (left). The phase image contrast is due to differences in hydrophobicity. 4μm scans. Images courtesy of C. Roberts, University of Nottingham.
Particles
Production of solid dosage forms commonly begins with the formation of the drug into particles, typically within the size of 0.1 to 10 micrometers. Characterization of these particles can be important before drug formulation since their morphology, size, and shape can provide information about the manufacturing process. Particle size has also been shown to influence dissolution rate, bioavailability, content uniformity, stability, texture, flow characteristics, and sedimentation rates, and thus has a significant effect on formulation and therapeutic efficiency.
There are many methods commonly used to investigate particles, such as light-scattering techniques like dynamic light scattering and laser diffraction. However, these techniques sample a large number of particles to provide a distribution of particle size or characteristics. There are often cases where studying the particles individually becomes a key step in understanding a particle system. One common method for directly studying individual particles is transmission electron microscopy (TEM). However, often the sample preparation of small particles for TEM is challenging and time consuming. AFM has successfully examined pharmaceutical particles directly to correlate their morphology to the manufacturing process and behavioral properties.
Figure 3 shows an example of using the AFM to characterize the drug particle morphology. Drug particles are traditionally formed by milling a drug crystal to particle sizes less than 10 micrometers by micronization or spray-drying techniques.

Figure 3. Height (left column) and phase (right column) images of paracetamol formed into drug particles by micronization and SEDS. Figure 3-1: raw starting material showing crystalline lamellae. Figure 3-2: micronized particle showing rough, irregular structure. Figure 3-3: SEDS particles showing regular, smooth structure with 0.9nm crystalline steps. Figure 3-4: Roughness of starting material, micronized particle, and SEDS particle. Images courtesy of Patel, Davies, and Roberts, Molecular Profiles, UK; and Palakodaty, Gilbert, York, Bradford Particle Design Ltd., UK.
However, problems can result from these techniques due to batch-to-batch variations, residual solvent, and statically-charged particles that can affect powder stability and flow. Another method of particle formation called solution enhanced dispersion by supercritical fluids (SEDS) overcomes many of these problems and provides more control of the particle size, shape, and morphology. The top left AFM image in figure 3-1 shows the starting raw material of paracetamol in which crystalline terraces can be seen. Images of particles formed by micronization and SEDS are shown in figures 3-2 and 3-3 respectively.
Micronized Particles
The micronized particles vary in size and are irregular with a significant amount of surface roughness, whereas, the SEDS particles have a regular shape and a size of approximately 10 micrometers, and show a reduction in roughness from the raw starting material (see the bottom right image of figure 3-4). As shown through AFM, the smoother surfaces and regular shapes produced by SEDS should reduce the batch-to-batch variations and static charge problems encountered with the micronized materials, as well as improve the flow properties of the particles.
Granules
Once the drug is in particulate form, it is often formed into a granule by mixing the drug particles with binding agents, diluents, and disintegrating agents. The wet granulation process consists of adding a liquid binder or adhesive to the mixture, passing the wetted mass through a screen sieve of the desired mesh size, and drying the granules. The resulting granules are typically in the range of a few millimeters, and show improvements in flow properties as well as chemical and physical stability with respect to particles. AFM has been very successful in characterizing the morphology and roughness of granules to correlate their surface structure to the underlying physicochemical and mechanical processes during the manufacturing process (see figure 4).
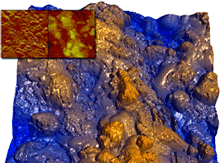
Figure 4. Surface morphology of a wet granule of caffeine, lactose, and polymers. Roughness measurements provide information about the formation process and physicochemical properties. Inset images —Amplitude (left) and Height (right) image. 5μm scan. Image courtesy of T. Li, K.R. Morris, and K. Park, Purdue University.
Coatings
There are many coatings that may be applied to tablets to serve various purposes. Common uses of pharmaceutical coatings consist of protecting the drug from air and humidity, providing a barrier to an objectionable tasting or smelling drug, and controlling the dissolution behavior. Sugar coatings are very commonly applied to tablets, as well as polymer coatings, which are more durable, less bulky, and less time-consuming to apply. The polymer coatings are often designed to rupture in the gastrointestinal tract to avoid stomach irritation and to improve drug adsorption. Coating granules and other drug substances are also key steps in the design of controlled-release and microencapsulated dosage forms.
AFM has been used commonly to correlate the surface of coatings and thin films to deposition parameters (such as temperature, rate, composition, etc.) and performance.
Common applications of AFM to investigate coatings consist of evaluating the surface morphology, roughness, surface area, compositional distribution, hardness, and porosity. Changes of these properties have also been studied with respect to aging and environment. Figure 5 shows a tablet coating that functions as a membrane for controlled-release applications in which pores were formed during the membrane leaching and drug release process. The pore structure, roughness, and surface area of the coating can easily be determined by the AFM.

Figure 5. Tablet coating showing complex pore structure. Surface structure, roughness, and surface area can be easily characterized. 5μm scan. Sample courtesy of ALZA Corporation.
Summary
AFM provides pharmaceutical researchers and manufacturers with a wide variety of techniques to evaluate the steps of the drug formulation process. The examples in this article indicate that with high-resolution imaging in air and fluid environments, AFM has found utility in the study of dynamic processes, fabrication variables, component distribution, and structure-function relationships. With its capability for TappingMode and PhaseImaging techniques, AFM provides information that cannot be acquired by other analytical techniques. Thus, AFM is finding increasing use in the pharmaceutical industry, which will undoubtedly lead to more applications and the adoptions of other SPM techniques.
.png)
This information has been sourced, reviewed and adapted from materials provided by Veeco.
For more information on this source, please visit Veeco.