Surface-Enhanced Raman Spectroscopy
In Raman spectroscopy, photons of light are incident on a sample to measure its molecular bond energies through the scattering of photons. The Raman spectroscopy intensity peaks are sharp for metallic bonds, whereas weak for non-metallic bonds, thus, to examine organic substances, often metallic substrates are used.
However, the surface enhancement of substrates can reduce the dependency on metal substrates to examine porphyrin-type molecules, which have great importance in medical diagnostics, security, forensics, and environment monitoring.
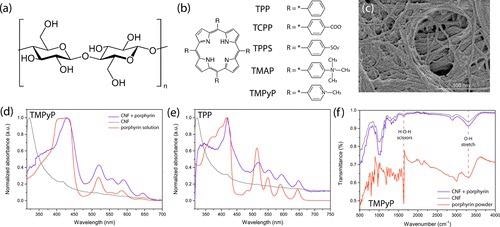
(a) Chemical structure of a cellulose molecule and (b) the porphyrin molecules used in the experiment. (c) SEM image of cellulose nanofibers on a silicon substrate. Normalized UV–vis absorption spectra of (d) TMPyP and (e) TPP porphyrin at 10–3 M concentration deposited on CNF compared to the background spectrum of CNF and the spectrum of the porphyrin in solution. (f) FTIR spectra of CNF compared to the spectrum of a sample porphyrin molecule (10–4 M TMPyP) on CNF and in powder form. Image Credit: Fularz, A et al., ACS Sustainable Chemistry & Engineering
Traditionally, there are two methods to enhance substrates in SERS viz. electromagnetic enhancement through localized surface plasmon resonance (LSPR) using metal nanoparticles, and chemical enhancement through the transfer of charge between the substrate and the analyte molecule.
Although chemical enhancement is a weaker process, metal/surface plasmon-based surface enhancement lacks biocompatibility and inertness, with high material and manufacturing costs. Recently, semiconductor-based substrates are being researched as an alternative to both methods.
Moreover, cellulose-based organic polymer materials combined with silver (Ag) and gold (Au) nanoparticles have shown promising Raman signal enhancement owing to their biocompatibility, flexibility, large surface area, and large nanoparticle holding capacity.
About the Study
In this study, cellulose nanofibers and TEMPO-oxidized cellulose nanofibers (TEMPO-CNF) were dispersed in distilled (DI) water down to the desired concentration and then sonicated for 20 minutes to ensure a uniform distribution of the fibers.
Subsequently, cellulose acetate powder and hydroxypropyl cellulose powder were dissolved in acetone and DI water, respectively, followed by drop-casting the cellulose on a silicon substrate and drying to obtain the cellulose substrates. Similarly, graphene oxide (GO) and silver nanoparticles (AgNPs) were also dispersed in DI water and then deposited on a silicon substrate.
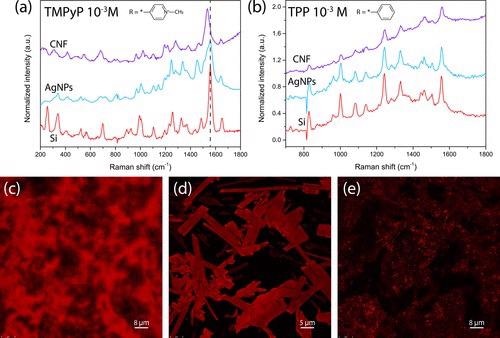
Normalized SERS spectra of 10–3 M (a) TMPyP and (b) TPP on CNF, AgNPs, and Si showing the shift in the position of the peaks. Fluorescence confocal microscopy images of (c) TMPyP on CNF, (d) TMPyP, and (e) CNF only showing the difference in the porphyrin structure. Image Credit: Fularz, A et al., ACS Sustainable Chemistry & Engineering
Subsequently, probe molecule solutions were prepared by dissolving powders of several nanoporphyrin molecules as analytes in DI water and/or dichloromethane (CH2Cl2) at an initial concentration of 10-2 or 10-3 M. These porphyrin-type molecules include mesotetraphenylporphyrin (TPP), meso-tetra(N-methyl-4-pyridyl)porphine tetrachloride (TMPyP), meso-tetra(N-methyl-4-pyridyl)porphine tetratosylate salt (TMPyP), 5,10,15,20-tetrakis(4-trimethylammoniophenyl)porphyrin tetra(p-toluenesulfonate) (TMAP), meso-tetra(4-sulfonatophenyl)porphine tetrasodium salt dodecahydrate (TPPS), and meso-tetra(4-carboxyphenyl)porphine (TCPP) methyl green (zinc chloride salt), victoria blue B (VBB), and methyl violet 2B (MV2B).
Then, all of the probe molecule solutions were diluted down to a standard fixed concentration of 10-4 M in their respective solvents followed by visual inspection of solubility at room temperature.
Observations
Scanning electron microscopy (SEM) image of the substrate synthesized using a highly concentrated cellulose dispersion showed a thick layer of randomly distributed nanofibers. The fibers consisted of bundles of several smaller elementary fibrils with a diameter of about 3 nm.
The presence of cellulose disrupts the nanorod assembly process of TMPyP and generated 3D clusters, which resulted in a change of the structure of the adlayer from ordered to disordered, a shift in the peak position in the Raman spectrum, and an increase in the Raman spectrum.
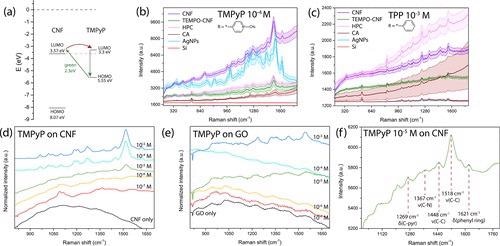
(a) Proposed band diagram showing a possible charge transfer between the CNF substrate and a TMPyP molecule. SERS spectra of porphyrins on different types of cellulose-based substrates compared to silver nanoparticles and silicon for (b) 10–4 M TMPyP and (c) 10–3 M TPP. Normalized SERS spectra of TMPyP on (d) CNF and (e) GO used for the determination of the detection limit. (f) Spectrum of 10–5 M TMPyP on CNF, highlighting the low detection limit on the metal-free substrate. Image Credit: Fularz, A et al., ACS Sustainable Chemistry & Engineering
Moreover, the Cl− counterion of TMPyP is attracted to the positively charged end of the −OH groups in the cellulose structure, resulting in the generation of a stable dipole moment and an electric field in the porphyrin adlayer, which enhanced the intensity and shift the Raman peaks in the spectrum.
Furthermore, the SERS signal of TMPyP with a Cl− ion had lower intensity than that of PTSA, indicating that the addition of cellulose has a more significant effect on the TMPyP/Cl− molecule, whereas the SERS signal was 19.3 times higher when the Cl− counterion was used and only 5.9 times higher for PTSA, confirming that the structure of the porphyrin affected the SERS spectrum.
Conclusions
The researchers developed a cellulose-based polymer substrate with Ag and Au nanoparticles to enhance the surface of the substrate to achieve a high-resolution Raman spectroscopy signal for organic molecules such as porphyrin-type molecules, which have great importance in biomedical applications.
TMPyP showed the highest enhancement results due to the generation of an electric field and a dipole moment in the adlayer of porphyrin. The CNF substrate demonstrated promising characteristics in comparison to other surface plasmon-free SERS substrates such as graphene, hence showing the approach is viable for future Raman spectroscopy substrate fabrication.
Reference
Fularz, A., Almohammed, S., and Rice, J., SERS Enhancement of Porphyrin-Type Molecules on Metal-Free Cellulose-Based Substrates, ACS Sustainable Chemistry & Engineering, 2021, https://pubs.acs.org/doi/10.1021/acssuschemeng.1c06685
Disclaimer: The views expressed here are those of the author expressed in their private capacity and do not necessarily represent the views of AZoM.com Limited T/A AZoNetwork the owner and operator of this website. This disclaimer forms part of the Terms and conditions of use of this website.