Oct 6 2020
As a probe of vibrational transitions, Raman scattering has made great progress since it was first discovered and is considered a phenomenon that has led to the development of various schemes and projects with considerable success.
Applications extend from basic scientific research to industrial and medical instrumentation. Some processes utilize linear Raman scattering, whilst others harness high peak-power fields to probe nonlinear Raman responses. This article aims to offer a concise overview of some of the various benefits and differences, in conjunction with the requirements of laser sources and the progress made in new methodologies enabled by recent developments in lasers.
Linear Raman
The emergence of the laser and its ability to provide a high-intensity coherent light source has made it possible to make Raman scattering an effective method for spectroscopy. This is achieved by increasing signal levels of the spontaneous event to facilitate the use of readily available detectors. The most common technique to date is linear Raman, which uses commercial continuous-wave lasers to its advantage.
The selection of excitation wavelength is influenced by the sample used, where typically, a shorter wavelength would produce a greater efficiency yet suffers from increased scattering and may cause damage in biological samples within the UV region. A diode-pumped solid-state (DPSS) laser with a wavelength between 473 nm and 1064 nm, a narrow bandwidth output of few tens of GHz or below 1 MHz if needed throughout the linewidth of vibrational transitions for high resolution, low noise (less than 0.02%) and superb beam quality (basic transversal electromagnetic mode TEM00) offers performance optimized for the resolution of the required Raman measurement.
The wavelength is selected based on the sample in question, with 532 nm being generally used for the necessary virtual electronic transition. In the next section, four examples from various areas of Raman applications illustrate the range of applications of linear Raman and what progress has been accomplished. An example of studying a real-world application, the effective control of food quality using Raman spectroscopy and multivariate analysis, is described by Jernshøj et al.1
Examination and review of the quality of meat and vegetables are addressed, along with the source specification, when designing a system for environments outside of laboratory conditions. For real-world applications, the laser source must work at the right output parameters while maintaining a sturdy design that makes it portable and very efficient when considering the integration into other instruments and being able to successfully port with the interfaces of operating software. The next two experiments benefit from the high resolution that a narrow linewidth laser source provides as well as its high-quality beam.
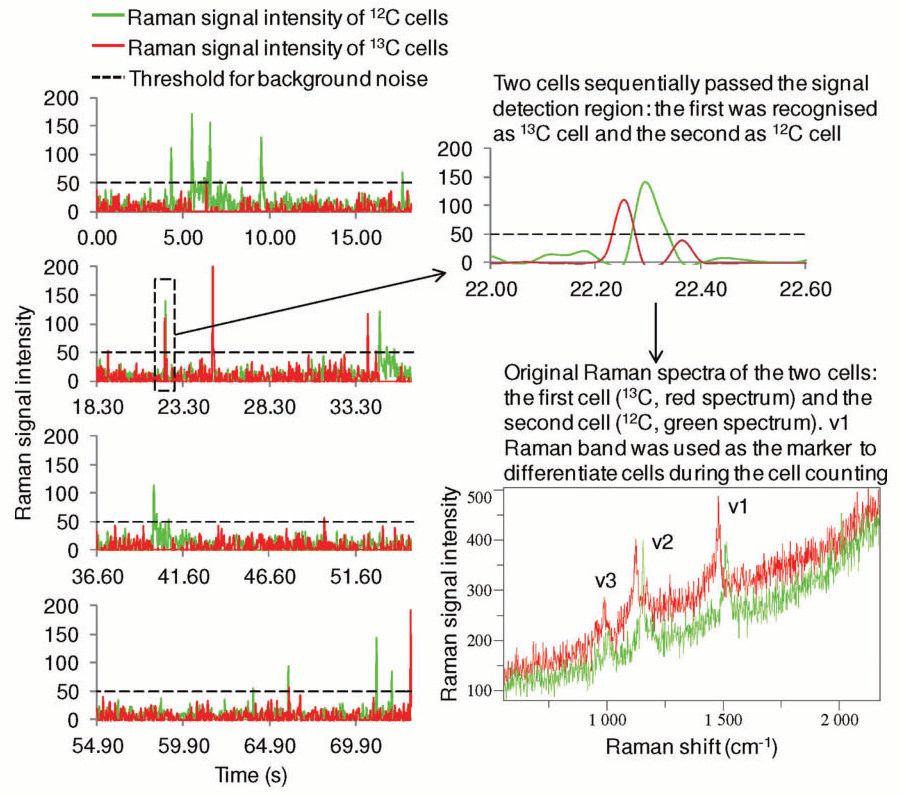
Figure 1. An example of the RR microfluidic device counting of photosynthetic microorganisms. As the cells of the model strain Synechocystis sp. PCC 6803 flow through the Raman detection area of the microfluidic device, RR spectra were acquired continuously about 27 times every second. The v1 RR band was used to differentiate 12 C- and 13 C-cells. The intensity of this band was plotted against the temporal axis and displayed in green and red for 12 C- and 13 C-cells, respectively. A part of the figure near 23.3 s was enlarged to show a 13 C- and 12 C-cell passed through the Raman detection area sequentially only about 0.1 s apart from each other; the untreated RR spectra of those two cells show a distinctive redshift of all of the carotenoids RR bands. Image Credit: Reprinted (adapted) with permission from Li et al2. Copyright (2012) American Chemical Society
Application of a single longitudinal mode (SLM) laser at 532 nm with a linewidth of 1 MHz allows high-resolution resonance Raman (RR) spectra from the excitation of carotenoids to distinguish between 13CO2 and 12CO2, used for high throughput profiling of cell populations2, see fig. 1. The cells under investigation are from photosynthetic microorganisms that are of exceptional value in the area of biotechnology and renewable energy. Throughout the research, a high throughput Raman-activated cell sorting (RACS) system has been prepared, to conduct Raman-activated cell counting.
Having the ability to concentrate the laser beam with high-precision provides spatial resolution in the order of 0.5 – 1 µm which is required to look at individual cells. A unique approach for accurate quantitative measurements of optical mobility in atomically thin films with reference to high-resolution Raman is put forward by Ji et al.3 Making use of a sizable change in the intensity of the Raman mode with an applied powerful magnetic field that appears in one plane, but not the out of plane Raman mode. It derives from a magnetic field induced symmetry breaking. A quantitative analysis of the field reliant Raman intensity enables identification of the optical mobility. The low noise and high power stability are essential for quantitative measurements.
Additionally, the high-quality beam of the SLM laser used (Laser Quantum torus), allows for confocal micro-Raman in the measurement setup. The linewidth most commonly used in continuous wave (CW) Raman is a few 10s of GHz, where most strong lasers are easily available. In cancer research, screening cells for the potential of cancerous behavior calls for an automated analysis system. Such a system based on laser tweezers Raman spectroscopy (LTRS) has been put forward by Casabella et al.4
The beam quality of the highest order in TEM00 ensures close focus as well as lasting, stable beam pointing which is necessary for trapping the individual cells in the microfluidic channels and for the Raman measurement. Two lasers of varying wavelengths were used (1064 nm for trapping, 532 nm for Raman, both from the Laser Quantum Ventus series), which was incorporated well into the overall system control by their capacity for remote control operation.
Some samples enabled more effective and efficient scattering when the Raman transition occurs close to a real transition. However, not every sample of interest would yield this benefit. Development of variations, such as surface-enhanced Raman scattering (SERS) or as a subvariant, tip-enhanced Raman scattering (TERS), increases the sensitivity and spatial resolution of linear Raman.
In SERS, structured surfaces are utilized to enhance the Raman signal level with the optimization of the electric field due to those structures. In recent times, hybrid structures that utilize nano-sized semiconductors, containing magnetic materials, have garnered interest due to their superb SERS performance, as outlined by Prakash and colleagues.5
In TERS, the excitation light is directed onto the sample via an atomic force microscope (AFM) tip under plasmonic effects. This fosters the ability to overcome the diffraction limit of the laser spot with increased spatial resolution, as well as delivering a field enhancement due to the tip geometry. In some instances, contingent on the sample, the signal’s increase due to the enhancement of the field circumvents any decrease due to a reduced number of oscillators (molecules) within the excitation volume. A high-quality laser beam with an excellent degree of polarization allows for a focal point of just a micrometer onto the AFM needle.
Furthermore, this produces efficient excitation of the polarization-dependent surface plasmon: the mechanism responsible for electric field enhancement at the tip of the needle. The articles by Kumar6 and Langelüddecke7 highlight the method and outline various applications. As is customary with input coupling into microscope setups, excellent beam pointing stability with rapid warmup times on the order of a few minutes can provide reliable operation on a daily basis which facilitates good concentration on the study.
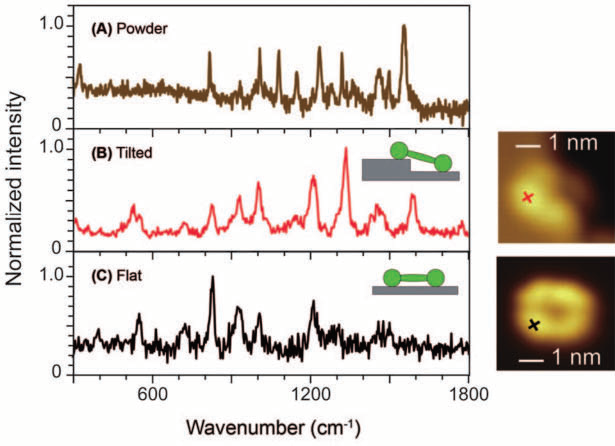
Figure 2. Single-molecule TERS of a porphyrin derivate examined with UHV-STM at low temperatures. (A) The Raman spectrum from powder represents many orientations, whereas (B) TERS was able to resolve a molecule tilt, and (C) also shows single-molecule resolution on a flatly oriented molecule. Especially the differences between TERS spectra (B) and (C) are remarkable. Image Credit: Adapted with permission from Xhang, et al.8 Copyright Macmillan Publishers Ltd. 2013
Following on from this, two examples of achievements using TERS are outlined before turning to non-linear Raman. The high spatial resolution of TERS has allowed for the visualization of the tilt of a single molecule by means of measuring a spectrum, see figure 2 from the paper by Zhang et al.8
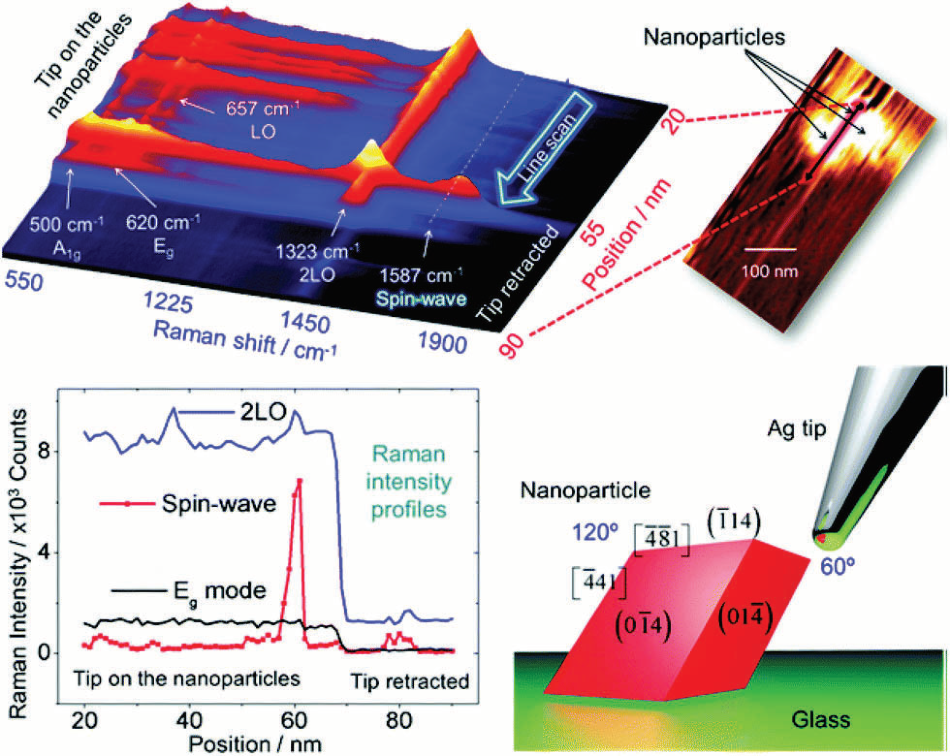
Figure 3. a) Tip-enhanced Raman spectra in a line scan along with the nano-particles/glass interface. The stacking representation shows several first-order modes below 700 cm−1, the 2LO mode around 1323 cm−1, and the spin-wave mode around 1587 cm−1. The step size used to obtain this set of spectra was 1 nm. In the inset is shown the AFM image acquired during the TERS line scan (b) intensity profiles of three modes along the line scan showing the sharp increase in the spin-wave intensity when the TERS tip is on the nanoparticle. This is followed by a decrease in the intensity of all modes when the tip was retracted (tip-off). (c) A sketch of the tip–nanoparticle configuration shows the anisotropy between the two sides of the particle with respect to the tip. Crystallographic facets and edges are set according to Rodriguez et al.27 Image Credit: Reprinted (adapted) with permission from Rodriguez et al.9 Copyright (2007) American Chemical Society] Copyright Macmillan Publishers Ltd. 2013.
Furthermore, using a spatial resolution of 0.5 nm, see fig. 2 (right side), the authors could resolve the ring system of a single porphyrin derivative. In another captivating experiment, TERS was able to expose spin waves in iron oxide nanoparticle, as explained by Rodriguez et al.9 and illustrated in fig. 3 using micro-Raman experiments.
Non-Linear Raman
To significantly increase the efficiency of the Raman process, various coherent (nonlinear) Raman processes have been examined. The Non-Linear Raman process makes use of at least two varying wavelengths, but also utilizes the equivalent Raman active vibrational mode as the linear Raman method. Generally, laser setups employing two laser beams that differ in color, and in pulsed mode allow a more intricate, but coherent process, that generates a signal which is typically orders of magnitude higher. In practice, the benefit of coherent Raman scattering over linear Raman is this overall higher signal. In Coherent Antistokes Raman Scattering (CARS), the variance between the two wavelengths is applied to coherently drive a Raman transition. Typically, it is common to use two narrow bandwidth picosecond electronically synchronized laser pulse trains, one of which is scanned in the wavelength to do CARS spectroscopy. The shape of the CARS signal varies from that of linear Raman, also the general sensitivity is restricted by the distinction between the resonant and non-resonant part of the signal. An outline of the technique is put forward in a book by Xie and colleagues.10
An alternative to Coherent Raman is Stimulated Raman Scattering (SRS), which also uses lasers of two different colors with synchronized output pulses to coherently drive a nonlinear process. The benefit is a considerably reduced non-resonant background, and that the output trace is equivalent to traditional Raman enabling existing databases of compound results to be used in conjunction with a quantitative interpretation of the measured data.11
SRS makes use of modulation of one of the laser beams, a double modulation technique. Stimulated Raman Gain and Opposite Loss Detection (SRGOLD) puts forward background-free detection and is the most recent variant using a three-color laser beam excitation scheme.12 In principal, versions of both CARS and SRS can be conducted using femtosecond or picosecond lasers (and even nanosecond lasers), each with distinct advantages and drawbacks.
In the past, two electronically synchronized tunable laser sources have been used13, or as is more common today, optical parametric oscillators, supplying optically synchronized pulses. However, today’s commercially available implementations tend to be impeded with restricted tuning speed, thus the slow in acquisition of a CARS/SRS spectrum.14
One refined solution that significantly increases the acquisition speed, or even allows single beam capability, is the use of multiplex CARS15,16 or multiplex SRS.17,18 With this method, a narrow band pump and a broadband Stokes pulse, or even still, one ultra-broadband spectrum with phase shaping provides all wavelengths with the capacity to record a large number of Raman shifts simultaneously.
However, parallel detection may need advanced and uniquely specific detectors and electronics.18 With extremely broadband laser oscillators that typically provide bandwidth on the order of 400 nm in the NIR as well as high-repetition-rate amplified systems (such as an OPCPA that offers a bandwidth of greater 300 nm), broadband single-beam Raman techniques have been made possible.
The bandwidth available enables a wavenumber range of up to 4000 cm-1. It also makes for an efficient combination of multiple modalities, or for rapid spectroscopic CARS modality using a relatively simple detector in the form of a photodiode. One application of CARS using broad bandwidth is built on the precept of spectral focusing.19 A basic implementation dependent on glass stretchers to measure two vibrational frequencies with two (or more) pairs of pump/stokes pulses synchronously is referred to as differential CARS (or D-CARS). One major benefit of this technique is the quick acquisition speed of a few seconds for final images and the effective rejection of non-resonant background utilizing the D-CARS signal.
This scheme of basic analysis enables rapid distinction concerning saturated and unsaturated lipids.20 The laser source supplying an appropriately large bandwidth not only permits single-beam CARS, but also has been employed in a multimodal, or hyperspectral scheme that amalgamates D-CARS covering a wavenumber range of 2600 cm-1 with a resolution of 10 cm-1 in combination with second harmonic generation (SHG) as well as two-photon fluorescence (TPF) imaging – all from a single beam while simultaneously using a pulse shaper.21,22
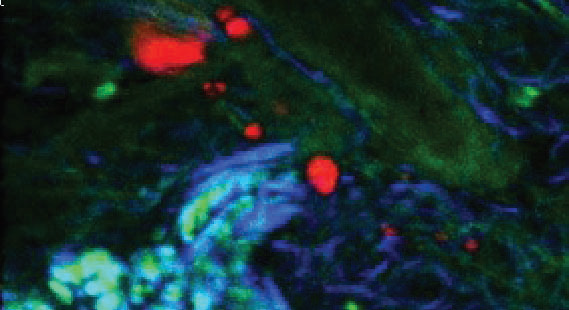
Figure 4. TPF (green), CARS from subcutaneous lipid deposits (red) and SHG from collagen (blue) of tissue from a mouse tail. Image Credit: Reprinted (adapted) with permission from by Pope et al.9 Copyright (2013) Optical Society of America
An example image is provided in fig. 4 illustrating vastly more information than from one imaging modality alone. An early implementation of spectral focusing using an octave spanning oscillator (Laser Quantum venteon) and a spatial light modulator to do single-pulse (single beam) CARS microscopy is presented by Isobe et al.23
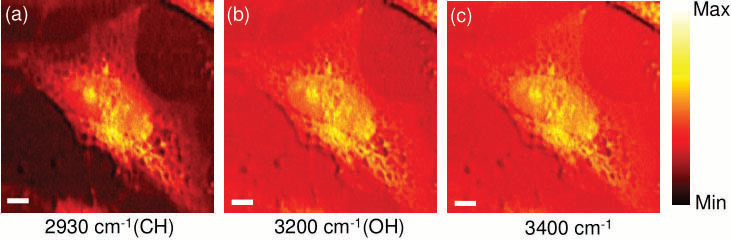
Figure 5. CARS images of an unstained HeLa cell by selective excitation at 2930 cm−1(a), 3200 cm−1 (b), and 3400 cm−1 (c). The scale bar is 6 μm. Image Credit: Reprinted (adapted) with permission from Isobe et al23. Copyright (2009) Optical Society of America
In fig. 5, CARS images of unstained HeLa cells are presented from this experiment illustrating the relevance and application to biological samples. Utilizing an octave spanning oscillator enabled the researchers to concentrate on narrow spectral regions ranging from approx. 1000 cm-1 to 4800 cm-1. The aim was for rapid measurements of spectroscopic CARS, the Fourier Transform (FT) CARS technique shows enormous potential. The principle has been demonstrated by Ogilve et al24 using a 100 MHz oscillator on the basis of a pump probe-type dual pulse setup.
In this method, the CARS spectrum is acquired via the Fourier transform of the CARS interferogram – i.e. the CARS emission as a function of the time delay between two identical collinear excitation pulse trains with a generated time delay between sequential pulses. The non-resonant background can be eliminated by simply withdrawing the contribution around zero time delay.
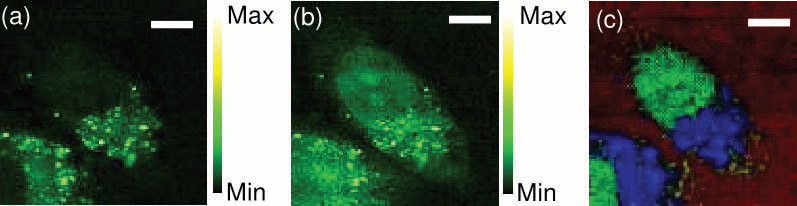
Figure 6. (a, b) CARS images of an unstained HeLa cell constructed from integration in the spectral bands of 2800-2900 cm−1 (a), and 2900-3000 cm−1 (b). (c) Combined image of three CARS images of an unstained HeLa cell reconstructed after the NSC process using the CARS spectrum from mitochondria or endoplasmic reticulum (blue), the nucleus (blue), and water (red). The scale bar is 8 μm. Image Credit: Reprinted (adapted) with permission from Isobe et al23. Copyright (2009) Optical Society of America
The identification of the CARS signal can be achieved with a simple Si-diode. Using a 5 fs oscillator with a spectral bandwidth of 4000 cm-1 the application of FT CARS to biological samples casing the bandwidth in a single measurement has been shown.23 An image of unstained HeLa cells was acquired by FT CARS (fig. 6) illustrating the differentiating of mitochondria or endoplasmic reticulum, the nucleus, and water.
The speed of acquiring a completed CARS spectrum using FT CARS is dependent upon how fast the two pulses can pass through the necessary delay times that assist the CARS interferogram. The refresh time is then reliant upon the speed of which this cycle can be repeated. The time delays which assist the interferogram rely on the dephasing time of the coherent Raman excitation, which is generally on the picosecond (ps) timescale.
The interferometric, non-resonant background being present at short delay times only and hence can be totally suppressed by appropriately positioning the numerical apodization window.26 In the application of the work published by Isobe and colleagues a mechanical delay line is used.23 The initial step necessary to speed up the measurement is to utilize an ASynchronous OPtical Sampling (ASOPS) dual comb-type setup. This is where two repetition rate locked laser oscillators with a slight offset in their rate of repetition are employed to produce the pulse pair.24
In such a situation, the refresh time is yielded by the inverse of the laser repetition rate. The measurement time of one scan relies on how the delay speed of the two pulses covers the timeframe of the interferogram. The advantage of using oscillators with 1 GHz repetition rate over a 100 MHz repetition rate in the implementation from Ideguchi25 is a refresh rate that is10 times higher. Therefore, this means 10 times greater duty cycle – number of measurements for the same integration time – combined with a much higher density of sampling steps at the same difference in repetition rates.
In other words, using GHz repetition rates at the equivalent sampling step size one can perform much higher refresh times, i.e. more measurements per unit time. The rapid acquisition time with a high refresh rate allows the measurement of transients or short-lived species. Recently, an initial implementation of such a dual-comb CARS system using two GHz oscillators has been performed.26 The bandwidth of the emitted pulses is 60 nm which allows for sub-20 fs compressed pulses. They allow measurements with a span from 400 – 1400 cm-1 and a resolution of 6 cm-1 produced by the time window of the Fourier transformation, at a kHz refresh rate with the real acquisition time of one scan as short as 5 µs.
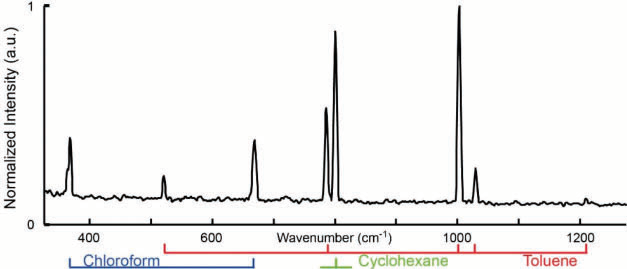
Figure 7. Dual-comb CARS spectrum of toluene, chloroform, and cyclohexane with a mixing ratio of 1:1:1. The difference in repetition frequencies is δf rep. 600 Hz. The apodized resolution is 6 cm−1 and 120 spectra are averaged. The measurement time is 2 ms and the total experimental time is 200 ms. Image Credit: Reprinted (adapted) with permission from Mohler et al26. Copyright (2013) Optical Society of America
To illustrate that this technique can measure at a suitable resolution to distinguish different substances, a spectrum of a mixture of chloroform, toluene, and cyclohexane has been taken, see fig. 7. While the two neighboring peaks of toluene and cyclohexane are only 13 cm-1 apart, they are clearly resolved. The measurement demonstrated a linear dependency of the line maximum with concentration as well as pulse energy, which will be useful when looking towards quantitative analysis. The use of oscillators with sub-20 fs allows extending the setup with capacity for multimodal or hyperspectral operation.
Conclusions
In conclusion, a range of linear Raman applications has been put forward to demonstrate ways in which they utilize superb beam quality as well as excellent beam pointing and power stability with low noise of modern laser sources including the narrow linewidth properties where applicable.
Great efficiency, strength, and remote operation potential offer prime advantages to all applications while being a requirement for good integration into industrial or automated systems. Due to greater accessibility, broadband pulsed laser sources that cover spectra of several hundred nm allow for rapid and coherent Raman measurements as well as offering efficient multimodality. Finally, Fourier Transform CARS combined with dual-comb technology provides swift spectroscopic CARS measurements, within microseconds. The use of GHz repetition rate oscillators provides for a factor of 10 higher refresh rates of the spectral acquisition in comparison to the readily available 100 MHz oscillators.
Acknowledgments
Produced from materials originally authored by Andreas Isemann from Laser Quantum GmbH.
References and Further Reading
- K. Jernshøj, S. Hassing, L. Christensen, A Non-Destructive and On-site Tool for Control of Food Quality, Food Quality, Kostas Kapiris. InTech - Open Access Publisher, (2012) 47-72.
- M. Li, P. Ashok, K. Dholakia, Wei E. Huang, Raman-Activated Cell Counting for Profiling Carbon Dioxide Fixing Microorganisms, The Journal of Physical Chemistry A, 116 (25) (2012) 6560-6563.
- J. Ji, A. Zhang, J. Fan, Y. Li, X. Wang, J. Zhang, E. Plummer, Q. Zhang, Giant magneto-optical Raman effect in a layered transition metal compound, PNAS, 113(9) (2016) 2349-2353.
- S. Casabella, P. Scully, N. Goddard, P. Gardner, Automated analysis of single cells using Laser Tweezers Raman Spectroscopy, Analyst, 141 (2016) 689.
- O. Prakash, S. Kumar, P. Singh, V. Deckert, S. Chatterjee, A. Ghosh, R. Singh, Surface-enhanced Raman scattering characteristics of CuO: Mn/Ag heterojunction probed by methyl orange: effect of Mn2+ doping, Journal of Raman Spectroscopy, 47 (2016) 813–818.
- N. Kumar, S. Mignuzzi, W. Su, D. Roy, Tip-enhanced Raman spectroscopy: principles and applications, J EPJ Techniques and Instrumentation D, 2(1) (2015).
- L. Langelüddecke, P. Singh, V. Deckert, Exploring the Nanoscale: Fifteen Years of Tip-Enhanced Raman Spectroscopy, Applied Spectroscopy 69(12) (2015) 1357 – 1371.
- R. Zhang, Y. Zhang, Z.C. Dong, S. Jiang, C. Zhang, L.G. Chen, L. Zhang, Y. Liao, J. Aizpurua, Y. Luo, J.L. Yang, J.G. Hou, Chemical Mapping of a Single Molecule by PlasmonEnhanced Raman scattering, Nature 498(7452) (2013) 82-86.
- R. Rodriguez, E. Sheremet, T. Deckert-Gaudig, C. Chaneac, M. Hietschold, V. Deckert, D. Zahn, Surface- and tip-enhanced Raman spectroscopy reveals spin-waves in iron oxide nanoparticles Nanoscale 7 (2015) 9545-9551.
- X. Xie, J.-X. Cheng, E. Potma, Coherent Anti-Stokes Raman Scattering Microscopy, Handbook of Biological Confocal Microscopy, Third Edition, edited by James B. Pawley, Springer Science+Business Media, LLC, New York, 33 (2006) 595-606.
- P. Nandakumar, A. Kovalev, A. Volkmer, Vibrational imaging based on stimulated Raman scattering microscopy, New Journal of Physics 11 (2009) 033026.
- P. Berto, E. R. Andresen, H. Rigneault, Background free stimulated Raman spectroscopy and microscopy, Physical Review Letters 112 (2014) 053905.
- E. Potma, D. Jones, J.-X. Cheng, X. Xie, J. Ye, High-sensitivity coherent anti-Stokes Raman scattering microscopy with two tightly synchronized picosecond lasers, Optics Letters 27 (2002) 1168–1170.
- S. Brustlein, P. Ferrand, N. Walther, S. Brasselet, C. Billaudeau, D. Marguet, H. Rigneault, Optical parametric oscillator-based light source for coherent Raman scattering microscopy: practical overview, Journal of Biomedical Optics 16(2) (2011) 021106.
- J.-X. Cheng, A. Volkmer, L. D. Book, X. Xie, Multiplex Coherent Anti-Stokes Raman Scattering Microspectroscopy and Study of Lipid Vesicles, The Journal of Physical Chemistry B 106 (2002) 8493-8498.
- A. Wipfler, T. Buckup, and M. Motzkus, Multiplexing Single-Beam CARS with Heterodyne Detection, Applied Physics Letters 100 (2012) 071102.
- D. Fu, F.K. Lu, X. Zhang, C. Freudiger, D. R. Pernik, G. Holtom, X. Xie, Quantitative Chemical Imaging with Multiplex Stimulated Raman Scattering Microscopy, Journal American Chemical Society, 134 (2012) 3623−3626.
- C.-S. Liao , M. N. Slipchenko, P. Wang, J. Li, S.-Y. Lee, R. A. Oglesbee, J-X Cheng, Microsecond scale vibrational spectroscopic imaging by multiplex stimulated Raman scattering microscopy, Light: Science & Applications, 4 (2015) e265.
- T. Hellerer, A.M.K. Enejder, A. Zumbusch, Spectral focusing: High spectral resolution spectroscopy with broad-bandwidth laser pulses, Applied Physics Letters 85(1) (2004) 25-27.
- C, Di Napoli, F. Masia, I. Pope, C. Otto, W. Langbein, P. Borri, Chemically-specific dual-differential CARS microspectroscopy of saturated and unsaturated lipid droplets, Journal of Biophotonics 7(1–2) (2014) 68-76.
- I. Pope, W. Langbein, P. Watson, P. Borri, Simultaneous hyperspectral differential-CARS, TPF and SHG microscopy with a single 5 fs Ti:Sa laser, Optics Express 21(6) (2013) 7096-7106.
- J. Rehbinder, L. Brückner, A. Wipfler, T. Buckup, M. Motzkus, Multimodal nonlinear optical microscopy with shaped 10 fs pulses, Optics Express 22(23) (2014) 28790-28797.
- K. Isobe, A. Suda, M. Tanaka, H. Hashimoto, F. Kannari, H. Kawano, H. Mizuno, A. Miyawaki, K. Midorikawa, Single-pulse coherent anti-Stokes Raman scattering microscopy employing an octave spanning pulse, Optics Express 17(14) (2009) 11259-11266.
- J. P. Ogilvie, E. Beaurepaire, A. Alexandrou, and M. Joffre, Fouriertransform coherent anti-Stokes Raman scattering microscopy, Optics Letters 31(4) (2006) 480–482.
- T. Ideguchi, S. Holzner, B. Bernhardt, G. Guelachvili, N. Picque, T. W. Hänsch, Coherent Raman spectro-imaging with laser frequency combs, Nature 502 (2013) 355-539.
- K. J. Mohler, B. J. Bohn, M. Yan, G. Mélen, T. W. Hänsch, N. Picque, Dual-comb coherent Raman spectroscopy with lasers of 1-GHz pulse repetition frequency, Optics Letters 42(2) (2017) 318-321.
- 27 R. D. Rodriguez, D. Demaille, E. Lacaze, J. Jupille, C. Chaneac and J.-P. Jolivet, Rhombohedral Shape of Hematite Nanocrystals Synthesized via Thermolysis of an Additive-free Ferric Chloride Solution, The Journal of Physical Chemistry C, 111(45) 2007 16866–16870.
This information has been sourced, reviewed and adapted from materials provided by Laser Quantum Ltd.
For more information on this source, please visit Laser Quantum Ltd.