Introduction Materials based on cobalt have attracted a great interest in view of their potential applications in scientific and technological fields [1-3]. Cobalt has been employed in the production of sensors [4,5], heterogeneous catalysts [6-8] and as intercalation compounds for energy storage [9-11]. Metallic multilayers composed of cobalt and noble metals have extensively been used for magneto-optic recording media. Most of these multilayers have been produced by molecular beam epitaxy, sputtering or vacuum deposition methods [12-18]. However, it has recently been shown that electrodeposition is an useful technique for growing Co multilayers [19-21]. Cobalt electrodeposition studies can be categorized according to the working electrode and the type of solution system employed [22, 23]. Most of the studies have been performed onto glassy carbon electrodes [24–29], and some others onto gold [28, 30, 31], nickel [32] and copper electrodes [24, 29]. Chloride solutions have been the preferred systems for studying the electrochemistry of cobalt [26-32], rather than sulfate systems [25, 33] or citrate solutions [23]. In summary, it has been found that cobalt electrodeposition predominantly initiates through progressive nucleation, which can change to instantaneous nucleation mechanisms by enhancing mass transfer, using ultrasound [25], or increasing cobalt concentration [28]. However, the electrodeposition of cobalt may occur through a nucleation process under charge transfer control too [34]. In electrodeposition, the underpotential deposition process (UPD) appears as an alternative for the production of cobalt thin films under room conditions of pressure and temperature. The UPD is in general identified from cyclic voltammetric studies by the presence of peaks corresponding to the (sub)-monolayer adsorption on the electrode at more positive potentials than the Nernst potential. Moreover, the charge involved in the adsorption and deposition processes can conveniently be analyzed by integrating the observed current response [35]. The presence of deposits in UPD conditions has mainly been associated to monocrystalline electrodes [36-39], although some studies have been reported for polycrystalline electrodes [30, 31, 40-42] and fewer onto glassy carbon electrodes [43-45]. The existence of cobalt UPD onto different substrates has been somehow controversial [46, 47]. However, some experimental results have confirmed the presence of these UPD processes onto gold substrates [30, 31]. Although many cobalt studies have been performed onto glassy carbon electrodes [24-29], up to our knowledge, UPD of cobalt onto glassy carbon electrodes has not been reported yet. Therefore, in order to gain a deeper insight into this system, in this work we carried out a voltammetric study about the UPD process of cobalt onto GCE from ammoniacal solutions. Experimental Cobalt deposition on GCE was carried out in a conventional three-electrode cell from an aqueous solution containing 10-2 M of Co(Cl04)2, and 1M NH4CI, pH 4.5 at 25°C. All solutions were prepared using analytic grade reagents (provided by Sigma-Aldrich company) with ultra pure water (Millipore-Q system) and were deoxygenated by bubbling N2 for 15 minutes before each experiment. The working electrode was a glassy carbon electrode (GCE) provided by Radiometer Copenhagen, made of a glassy carbon rod embedded in Teflon. The exposed surface area (0.0707 cm2) was polished to mirror finish with different grades of alumina down to 0.05 μm and ultrasonically cleaned before experiments. A platinum wire with an exposed area greater than the working electrode was used as counter electrode. A Ag/AgCl (KCl sat.) electrode was used as reference, and all potentials refer to this scale. The electrochemical experiments were carried out with a BAS100B potentiostat connected to a personal computer running BAS-100W software for control of experiments and data acquisition. The rotating disk electrode study was carried out employing a EDI101T and CTV101T equipment provided by Radiometer Copenhagen. Results and Discussion Pourbaix’s Diagram The chemical composition of the deposition bath plays a very important role during the electrodeposition process. Thus, specific chemical species in the deposition bath can induce changes in the thermodynamic and the kinetic parameters during the electrodeposition process since they can even modify the electronic structure of the substrate. Therefore, in order to establish the chemical species in the deposition bath, and their equilibrium potentials that prevail under our experimental conditions, we have carried out a thermodynamic study by employing the Pourbaix’s Diagram. Figure 1 shows the predominance-existence Pourbaix’s diagram, E vs pH, calculated by considering the five-components system Co(II)-ClO4--Cl--NH3-H+ [48]. The equilibrium constants of the different chemical proceses associated to these species, at the working ionic strength, were obtained from literature [49]. Under our experimental conditions, the predominant chemical species is the Co(H2O)62+ complex [29] and the equilibrium potential for the Co(H2O)62+/Co0 couple is -0.354 V vs NHE. ( -0.550 vs Ag/AgCl)(Figure 1). In this system, last result indicates that the electrochemical reduction processes located at E>-0.550 V vs Ag/AgCl are underpotential deposition processes, while at more negative potentials than -0.550 V vs Ag/AgCl the processes are overpotential deposition processes. 
Figure 1. Pourbaix’s diagram for the 10-2 M of Co(Cl04)2, and 1 M NH4CI, system at 25ºC, considering the five-components system Co(II)-ClO4-Cl--NH3-H+. Voltamperometric Study Cyclic Voltammetry Cyclic voltammetry was performed in the [0.600 to −1.200] V potential range in order to verify the electrochemical behavior of the electrode in the electrodeposition bath, and to identify the presence of the electrodeposition procceses in both the UPD and the opd zones. Figure 2 shows a cyclic voltammogram obtained in the GCE | 10-2 M Co(ClO4)2 + 1 M NH4Cl (pH 4.5) system. In the inset, it is shown that during direct scan appears a decrease of the cathodic current at -0.160 V and one peak at -0.490 V approximately (peak A). Furthermore, a cyclic voltammetric measurement in the GCE electrode immersed in an aqueous solution containing just the supporting electrolyte, 1 M NH4Cl, did not show the peak A (see inset in Figure 2). This suggests that peak A is related to the cobalt reduction. Moreover, the potential of the [Co(H2O) 6]2+/Co0 couple has been found in our thermodynamic study as -0.550 V vs Ag/AgCl ( KCl sat.)(Figure 1). 
Figure 2. A comparison of two cyclic voltammetric curves obtained in the GCE/x M CoClO4, 1 M NH4CI (pH 4.5) system at two different CoClO4, concentrations (a) x=0 (- - -) and (b) x=10-2 M (—).The potential scan was started at 0.600 V towards the negative direction with a scan potential rate of 10 mV s-1. The beginning of the current decrease was detected at -0.160 V vs Ag/AgCl. This potential value is located at more positive potential values than the equilibrium potential, which is characteristic of the underpotential deposition process. In this potential region, it may be possible to get cobalt monolayers accordingly with the characteristics of the deposits obtained within the underpotential condition [35]. A second peak, B, was detected at -1.120 V (overpotential zone), where “occurs” a tridimensional nucleation and growth of cobalt deposition. Under these potential conditions the cobalt deposits are massive and random [29] on the electrode surface. In future works, we will carry out a morphological characterization of the structure of these deposits employing Scanning Tunneling Microscopy (STM) and Atomic Force Microscopy (AFM). During the inverse potential scan, it is possible to note two crossovers of the cathodic and anodic branches, typical of the formation of a new phase, involving a nucleation process [41]. The first one was found at -1.060 V, and the second one at -0.620 V, approximately. In the anodic region it is possible to observe two peaks, C and D, at -0.460 V and -0.204 V, respectively, which may be related to the oxidation of different cobalt phases. We measured the magnitude of the integrated charge under the UPD region, [0.600 - -0.550 V] range and we found a charge value of approximately 580 Ccm-2; last value corresponds to the necessary charge for deposit a cobalt monolayer onto GCE. Influence of the Scan Rate In last section, it was possible to identify cobalt UPD processes onto a GCE electrode by using cyclic voltammetry. An important feature of the voltammetric peaks obtained in UPD conditions is that their current density depends on the scan rate value; however, the potential value of these peaks does not change. Thus, in order to verify this behavior and to ensure the presence of the cobalt UPD processes, we carried out a cyclic voltametric study at different scan rates. Figure 3 shows a set of cyclic voltammograms obtained in the GCE | 10-2 M CoClO4 + 1 M NH4Cl (pH 4.5) system at different scan potential rates. During the direct scan it was possible to note, in all cases, the presence of peak A at -0.490 V, approximately. Note that the current density associated with peak A depends on the scan rate value and the potential value of these peaks does not change appreciably. Last behavior is typical of the underpotential deposition processes. 
Figure 3. Cyclic voltammograms obtained in the GCE/1O-2M CoClO4, 1M NH4CI (pH 4.5) system at different scan potential rates. In all cases the potential scan was started at 0.6 V towards the negative direction. In order to determine the type of control that limits the process associated with peak A, the density current value associated with (jp) was plotted as a function of ν1/2 (Figure 4). A linear relationship was found; according with the Berzins-Delahay’s equation [50]. 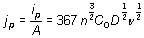 , (1) , (1)
where ip is the current peak, n is the number of electrons transferred, A is the area, C0 is the concentration in the bulk, D is the diffusional coefficient, and ν is the potential scan rate, a linear relationship of jp vs ν1/2 was found, which suggests a cobalt diffusional control process associated with peak A [50]. From the slope´s value and equation (1) it was possible to calculate the diffusion coefficient value as 1.95X10⁻⁵ cm2s-1. Last result compares favorably with the values reported in literature [29-31]. Indeed, we plotted the density current associated with peak B versus ν1/2 too (not shown), and we obtained the characteristic straight linear behavior reported for the overpotential deposition process of cobalt onto GCE [29]. 
Figure 4. Plot of the experimental cathodic current density peak (jp) as a function of scan rate (v1/2) for Peak A (see Figure 3). The straight line corresponds to the linear fit of the experimental data. Influence of the Inversion Potential In order to identify the potential value where the UPD of cobalt begins, we carried out a cyclic voltammetric study at different inversion potential values. Before each experiment, we recorded the corresponding direct scan onto the electrolyte support (1 M NH4Cl) to ensure that the peaks corresponded to the cobalt reduction. Figure 5 shows the anodic region of this voltammetric study below -0.500 V. Note that when Eλ = -0.200 V, a signal appears in the anodic region that corresponds to the dissolution of the cobalt previously deposited (Peak I). This result suggests an UPD deposition of cobalt onto GCE that approximately starts at -0.200 V. When Eλ was -0.400 V, we observed the presence of two peaks, I and II, which probably correspond to the existence of two phases of cobalt deposited during the direct scan in the UPD region [51]. Note that the phase associated with peak II predominates from -0.400 V. Last results suggest the existence of at least two UPD procceses with different kinetics that will be analysed in a future work by employing potentiostatic techniques. 
Figure 5. Cyclic voltammograms obtained in GCE/1O-2M CoClO4, 1 M NH4CI (pH 4.5) system at different inversion potentials indicated in the Figure. Cyclic voltammogram obtained in the GCE/ 1M NH4CI (pH 4.5) system at -0.450 V inversion potential ( - - - ) is showed too. Voltammetric Stripping From last section, we detected two electrochemical signals that can be associated with different cobalt phases [51] in the UPD region. In order to identify the potential value ranges where these phases appeared; we carried out a voltammetric stripping study. Voltammetric stripping experiments (Figure 6) were made in the GCE / 10-2 M Co(ClO4)2 + 1 M NH4Cl (pH 4.5) system from the cobalt deposits obtained at different Eλ in the [0 - -0.450] V range. The oxidation scan was made at 10 mVs-1 and the stripping scan always started at a potential at which no deposition occurred. Note that the current increased from -0.200 V and the apparition of the peak I is very clear at -0.250 V. This results suggests that the cobalt UPD starts at -0.200 V. When the Eλ was -0.370 V a small shoulder could be observed at 0.067 V, Figure 6l; note that to values more negatives than -0.370 V, peak II increase its current value, suggesting that this cobalt phase began to be predominant. At -0.410 V this predominance is evident, see Figure 6e. Thus, the first phase is predominant in the range [-0.200 - -0.370] V while the second one in the range [-0.380 - -0.450] V. Note that the position of these peaks was independent of Eλ. If one uses 1 M NH4Cl as the stripping media, the dissolution peaks are practically found at the same potentials, as when the stripping was made in the deposition solution. More experimental work is necessary to identify the structure of these cobalt phases; however the morphological characterization is beyond the scope of the present work. In future studies, the morphological characterization of these cobalt phases will be carried out by AFM and STM. 
Figure 6. Linear voltammograms obtained onto GCE/10-2M CoClO4, 1 M NH4CI (pH 4.5) system at different inversion reduction potentials a) -0.450 b) -0.440 c) -0.430 d) -0.420 e) -0.410 f) -0.400 g) -0.390 h) -0.380 I) -0.370 j) -0.360 k) -0.350 l) -0.340 m) -0.330 n) -0.320 o) -0.310 p) -0.300 q) -0.290 r) -0.280 s) -0.270 t) -0.260 u) -0.250 v) -0.200 and x) -0.100 V. Influence of the Rotating Disk Electrode At the initial stages of the deposition proccess, the density current associated with the double-layer charge may overlap with the density current related with deposition procceses. In order to analyze the influence of the double layer charge in the UPD processes of cobalt onto GCE electrode, we performed a voltammetric study employing RDE. An advantage of hydrodynamic methods such as RDE is that a steady state is attained rather quickly and measurements can be made with high precision. In addition, at the steady state, the double-layer charge does not contribute to the measurements [52]. Therefore, it can be possible to study only the current due to the UPD process employing RDE. Figure 7 shows the voltammograms obtained from the GCE | 10-2 M Co(ClO4)2 + 1 M NH4Cl (pH 4.5) system at different rotation rates. During the direct scan, there is a decrease of current density at -0.160 V, approximately. In the inverse scan, in all cases, the presence of a constant plateau in the cathodic zone which is characteristic of the steady state is observed. In the anodic zone, it is possible to observe the presence of two peaks, I and II, at 0.045 and 0.067 V, approximately. 
Figure 7. Cyclic voltammograms obtained in the GCE/1O-2M CoClO4, 1 M NH4CI (pH 4.5) system at different scan rotation rates. The presence of these two peaks suggest the existence of at least two phases of cobalt deposited during the direct scan [51]. The relationship between the limit current density (jL) versus the rotation rate1/2 (ω1/2 ) follows the Levich equation [53], 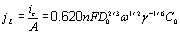 , (2) , (2)
where ic, γ, and ω are limit current, the kinematic viscosity and the rotation rate, respectively, and all other parameters have their conventional meanings. On the basis of equation 2, in Figure 8 we have plotted jL versus ω1/2, note that the current increases with the rotation values. The linearity in the jL versus ω1/2 plot suggests that this UPD process is limited by mass transport too [53]. From the slope’s value of this plot it is possible to calculate the value of the diffusion coefficient, which corresponds to 2.1X10⁻⁵ cm2s-1. This value is similar with that obtained from equation (1) and to those reported in literature [29-31]. It is interesting to observe that peak I is predominant in all cases when different rpm are applied. When the hydrodynamic regime is not employed, the opposite behavior is observed as seen in Figure 6. Thus, the formation of the first phase is favored when the thickness of the diffusional layer is decreased. This result suggests the presence of competitive processes between the charge of the double layer and the deposition process of the first phase of cobalt deposited in the UPD conditions. 
Figure 8. Plot of the experimental cathodic limit current density (jL) as a function of the scan rotation (ω1/2). The straight line corresponds to the linear fit of the experimental data. Conclusions We have carried out an electrochemical study of cobalt electrodeposition onto a glassy carbon electrode from an aqueous 10-2 M CoClO4, 1M NH4CI (pH 4.5) solution through voltammetric techniques (cyclic, inversion potential, linear and rotating disk electrode voltammetry). The analysis of the experimental data clearly showed that there is an underpotential deposition process of cobalt onto GCE that begins at -0.160 V vs Ag/AgCl ( KCl sat.). The linear plots of the jp vs ν1/2 and jL vs ω1/2 also suggested that the UPD process of cobalt onto GCE was diffusional-controlled. Linear, inversion potential and Rotating Disk Electrode voltammetry studies suggested the existence of at least two phases of cobalt deposited onto GCE in UPD conditions. The formation of the first phase was favored in the [-0.200 - -0.370] V range and when the thickness of the diffusional layer decreased, while the second one was favored in the range [-0.380 - -0.550] V Acknowledgments C.H.R.R. is grateful for a graduate student fellowship from CONACYT. We gratefully acknowledge financial support from SEP-PROMEP and the Universidad Autónoma del Estado de Hidalgo. L. M. gratefully acknowledges financial support from CONACyT project 46308. LHMH and CAGV also thank SNI (Mexico) for economical support. References 1. V.M. Jimenez, A. Fernandez, J.P.Espinos and A.R. Gonzalez-Elipe, “The state of the oxygen at the surface of polycrystalline cobalt oxide”, J. Electron Spectrosc. Relat. Phenom., 71 (1995) 61-71. 2. H. Hamada, M. Haneda, N. Kakuta, H. Miura, K. Inomi, T. Nanba, W. Qi Hua, A. Veno, H. Ohfune and Y. Udagawa, “Effects of Co Ion Dispersion upon Selective Catalytic Reduction of NO on CoO/Al2O3 Catalysts”, Chem. Lett., 26 (1997) 887. 3. M. Tanaka, M. Mukaia, Y. Fujimuri, M. Kondoh, Y. Tasaka, H. Baba and S. Usami, “Transition metal oxide films prepared by pulsed laser deposition for atomic beam detection”, Thin Solid Films, 281-282 (1996) 453-456. 4. M. Ando, T. Kobayashi, S. Iijima and M. Harita, “Optical recognition of CO and H2 by use of gas-sensitive Au–Co3O4 composite films”, J. Mater. Chem., 7 (1997) 1779-1783. 5. H. Yamaura, J. Tamaki, K. Moriya, N. Miura and N. Yamazoe, “Highly Selective CO Sensor Using Indium Oxide Doubly Promoted by Cobalt Oxide and Gold”, J. Electrochem. Soc., 144 (1997) L158-L160. 6. P. Nkeng, J. Koening, J. Gautier, P. Chartier and G. Poillerat, “Enhancement of surface areas of Co3O4 and NiCo2O4 electrocatalysts prepared by spray pyrolysis”, J. Electroanal. Chem., 402 (1996) 81-89. 7. S. Weichel and P.J. Møller, “Annealing-induced microfaceting of the CoO(100) surface investigated by LEED and STM”, Surf. Sci., 399 (1998) 219-224. 8. Y. Okamoto, T. Imanaka and S. Teranishi, “Surface structure of CoO-MoO3/Al2O3 catalysts studied by X-ray photoelectron spectroscopy”, J. Catal., 65 (1980) 448-460. 9. K. Ramachandram, C.O. Oriakhi, M.M. Lerner and V.R. Koch, “Intercalation chemistry of cobalt and nickel dioxides: A facile route to new compounds containing organocations”, Mater. Res. Bull., 31 (1996) 767-772. 10. M.G. Hutchins, P.J. Wright and P.D. Grebenik, “Comparison of different forms of black cobalt selective solar absorber surfaces”, Solar Energy Mater., 16 (1987) 113-131. 11. E. Barrera, I. Gonzales and T. Viveros, “A new cobalt oxide electrodeposit bath for solar absorbers”, Sol. Energy Mater. Sol. Cells, 51 (1998) 69-82. 12. P.F. Carcia, A.D. Meinhaldt, A. Suna, “Perpendicular magnetic anisotropy in Pd/Co thin film layered structures”, Appl. Phys. Lett., 47 (1985) 178-180. 13. H. J. G. Draaisma and W. J. M. de JongeF. J. A. den Broeder, “Magnetic interface anisotropy in Pd/Co and Pd/Fe multilayers”, J. Magn. Magn. Mater., 66 (1987) 351-355. 14. P.F. Carcia, “Perpendicular magnetic anisotropy in Pd/Co and Pt/Co thin-film layered structures”, J. Appl. Phys., 63 (1988) 5066-5073. 15. N. Sato, “Crystallographic structure and magnetism of Co-Pd and Co-Pt films with an artificially layered structure”, J. Appl. Phys., 64 (1988) 6424-6433. 16. W.B. Zeper, F.J.A.M. Greidanus and P.F. Carcia, “Evaporated Co/Pt layered structures for magneto-optical recording”, IEEE Trans. Magn., 25 (1989) 3764-3766. 17. S. Hashimoto and Y. Ochiai, “Co/Pt and Co/Pd multilayers as magneto-optical recording materials”, J. Magn. Magn. Mater., 88 (1990) 211-226. 18. S.J. Greaves, P.J. Grundy and R.J. Pollard, “Magnetic properties of cobalt layers and Co/Pt multilayers”, J. Magn. Magn. Mater., 121 (1993) 528-531. 19. V. Georgescu, V. Mazur and O. Cheloglu, “Preparation and magnetic properties of electrodeposited Co/Pt multilayers”, J. Magn. Magn. Mater., 156 (1996) 27-28. 20. Y. Jyoko, S. Kashiwabara and Y. Hayashi, “Preparation and characterization of electrodeposited Pt/Co multilayers”. J. Magn. Magn. Mater., 156 (1996) 35. 21. V. Georgescu, V. Mazur and B. Pushsashu, 16th General Conference of the Condensed Matter Division of the European Physical Society, in: K.U. Leuven, 1997, Abstracts, Print Service, Leuven, pp. 118. 22. D. Grujicic and B. Pesic. “Electrochemical and AFM study of cobalt nucleation mechanisms on glassy carbon from ammonium sulfate solutions”, Electrochimica Acta., 49 (2004) 4719-4732. 23. S.S. Abd El Rehim, S.M. Abd El Wahaab, M.A.M. Ibrahim and M.A. Dankeria, “Electroplating of cobalt from aqueous citrate baths”, J. Chem. Technol. Biotechnol., 73 (1998) 369-376. 24. E. Gomez and E. Valles, “Thick cobalt coatings obtained by electrodeposition”, J. Appl. Electrochem., 32 (2002) 693-700. 25. S. Floate, M. Hyde and R.G. Compton, “Electrochemical and AFM studies of the electrodeposition of cobalt on glassy carbon: an analysis of the effect of ultrasound”, J. Electroanal. Chem., 523 (2002) 49-63. 26. E. Gomez, M. Marin, F. Sanz and E. Valles, “Nano and micrometric approaches to cobalt electrodeposition on carbon substrates”, J. Electroanal. Chem., 422 (1997) 139-147. 27. A.B. Soto, E.M. Arce, M. Palomar-Pardave and I. Gonzales, “Electrochemical nucleation of cobalt onto glassy carbon electrode from ammonium chloride solutions”, Electrochim. Acta., 41 (16) (1996) 2647-2655. 28. N. Myung, K.H. Ryu, P.T.A. Sumodjo and K. Nobe, “Electrodeposition of Ni/Cu and Co/Cu multilayers”, Electrochemical Society Proceedings, PV 97-27 (1998) (Fundamental Aspects of Electrochemical Deposition and Dissolution Including Modeling) 270-281 29. M. Palomar-Pardave, I. González, A.B. Soto and E.M. Arce, “Influence of the coordination sphere on the mechanism of cobalt nucleation onto glassy carbon”, J. Electroanal.Chem., 443 (1998) 125-136. 30. L. H. Mendoza-Huizar, J. Robles and M. Palomar-Pardavé, “Nucleation and growth of cobalt onto different substrates: Part I. Underpotential deposition onto a gold electrode”, J. Electroanalitycal Chem., 521 (2002) 95-106. 31. L. H. Mendoza-Huizar, J. Robles and M. Palomar-Pardavé, “Nucleation and growth of cobalt onto different substrates: Part II. The UPD-opd transition onto a gold electrode”, J. Electroanalytical Chem., 545 (2003) 39-45. 32. C.Q. Cui, S.P. Jiang and A.C.C. Tseung, J. Electrochem. Soc., 137 (11) (1990) 3418. 33. H. Nakano, K. Nakahara, S. Kawano, S. Oue, T. Akiyama and H. Fukushima, “Effect of electrolysis factors on crystal orientation and morphology of electrodeposited cobalt”, J. Appl. Electrochem., 32 (2002) 43-48. 34. S.S. Abd El Rehim, Magdy A.M. Ibrahim and M.M. Dankeria, “Electrodeposition of cobalt from gluconate electrolyte”, Journal of Applied Electrochemistry, 32 (2002) 1019–1027. 35. V. Sudha and M.V. Sangaranarayanan, “Underpotential Deposition of Metals: Structural and Thermodynamic Considerations”, J. Phys. Chem. B, 106 (2002), 2699-2707. 36. M. J. Armstrong and R. H. Muller, J. Electrochem. Soc., 138 (1991) 2303. 37. M. Wünsche, R.J. Nichols, R. Schumacher, W. Beckmann and H. Meyer, “Influence of the additives (TU) and (PEG) on the underpotential deposition of copper on platinum electrodes: a coulometric, microgravimetric and topographic study”, Electrochim. Acta., 38 (1993) 647-652. 38. R.M. Rynders and R.C. Alkire, J. Electrochem. Soc. 141 (1994) 1166 39. W. J. Lorenz, E. Schmidt, G. Staikov and h. Bort, “Metal ion adsorption and electrocrystallization”, Faraday Symposia Chem. Soc., 12 (1977) 14-23. 40. D.P. Bhatt, T. Twomey, W. Plieth, R. Schumacher and H. Meyer, “Inhibition of the underpotential deposition of copper on single crystalline platinum surfaces”, J. Electroanal. Chem., 322 (1992) 279-288. 41. J. W. White and H. D. Abruña, “Influence of competing adsorbates on the underpotential deposition of copper on Pt(111)”, J. Electroanal. Chem., 300 (1991) 521-542. 42. P. Ocón, P. Herrasti, C. Palacio, M.E. Vela, R.C. Salvarezza, L. Vázquez and A.J. Arvia, “The role of slow surface-atom reordering processes in the underpotential deposition of metals”: Silver underpotential deposition on platinum in acid solutions”, J. Electroanal. Chem., 357 (1993) 339-355. 43. C. Mayer and K. Jüttner. “The electrocatalytic influence of underpotential lead adsorbates on the reduction of oxygen at glassy carbon electrodes in acid solution”, Electrochimica Acta., 27 (1982) 1609-1613. 44. S. Jaya, T. Prasada Rao and G. Prabhakara Rao. “Mono and multilayer formation studies of thallium on glassy carbon electrode”, Electrochimica Acta., 31 (1986) 343-348. 45. P. Kiekens, E. Temmerman and F. Verbeek, “Voltammetric study of the redox behaviour of the Hg(II)/Hg(I)/Hg system at a rotating metal-ring/glassy-carbon disc electrode”, Talanta., 31 (1984) 693-701. 46. W. Schindler, D. Hofmann and J. Kirschner, “Localized Electrodeposition Using a Scanning Tunneling Microscope Tip as a Nanoelectrode” , J. Electrochem. Soc., 148 (2001) C124-C130. 47. L. Cagnon, A. Gundel, T. Devolder, A. Morrone, C. Chappert, J.E. Schmidt and P. Allongue, “Anion effect in Co/Au(111) electrodeposition: structure and magnetic behavior”, Appl. Surf. Sci., 164 (2000) 22-28. 48. A. Rojas-Hernández, M.T. Ramírez and I. González, “Equilibria among condensed phases and a multi-component solution using the concept of generalized species: Part I. Systems with mixed complexes”, Anal. Chim. Acta., 278 (1993) 321-333. 49. Academic Software, The IUPAC Stability Constants Database, 1992-2000. 50. T. Berzins and P. Delahay, “Oscillographic Polarographic Waves for the Reversible Deposition of Metals on Solid Electrodes”, J. Am. Chem. Soc., 75 (1953) 555-559. 51. V.D. Jovic, R.M. Zejnilovic, A.R. Despic and J.S. Stevanovic, “Characterization of electrochemically formed thin layers of binary alloys by linear sweep voltammetry”, J. Appl. Electrochem, 18 (1988) 511-520. 52. A.J. Bard, L.R. Faulkner, Electrochemical Methods. Fundamental and Applications (Ch. 5), Wiley, New York, 2001. 53. G. Levich, “Physicochemical Hydrodynamics”, Prentice Hall, Englewood Cliffs, N.J., 1962. Contact Details |