In this article, Oxford Instruments presents an experiment using electron back-scatter diffraction (EBSD) to characterise changes in microsctructure in the tensile region of a bent sheet of 6063 aluminium alloy, during in-situ isochronal heating.
It has been shown that the bending process creates a gradient in both texture and strain across the tensile region. These experiments accounts for this, following the strain gradient-driven recovery and recrystallisation.
The Oxford Instruments Symmetry EBSD detector was chosen for this study, as it is capable of handling infrared emissions from heated samples. This detector uses the standard phosphor screen supplied with Oxford Instruments’ EBSD detectors.
Experimental
A 2 mm thick aluminium sheet (see table 1 for composition) was bent perpendicular to the rolling direction. Samples were cut from the bend, which were then planed mechanically to about 1.5 mm thick.
The aluminium was then diamond-polished to a 1 μm finish and electro-polished using Struers A2 electrolyte. The samples were finished with a short ion mill in a Fischione 1060 SEM mill.
Table 1. The composition of aluminium alloy 6063. Source: Oxford Instruments
| Element wt% |
Mg |
Fe |
Si |
Al |
| 6063 |
0.45-0.9 |
0.35 |
0.20-0.6 |
Remainder |
The samples were carefully mounted on a heating stage supplied by Manchester University. The stage was mounted in a FEGSEM in which imaging and EBSD was conducted using a Symmetry detector with AZtec® software.
Data was acquired from the tensile region of the bent sample, as shown in the schematic diagram in Figure 1. The isochronal heating cycle is shown in Figure 2. EBSD data was acquired at ambient temperature, 243, 320, 350, 363, 382, 400, 425 and 440 ºC.
Typical EBSD patterns at ambient and at 425 ºC are shown in Figures 3a and b respectively, illustrating that heating has little affect on the pattern quality.
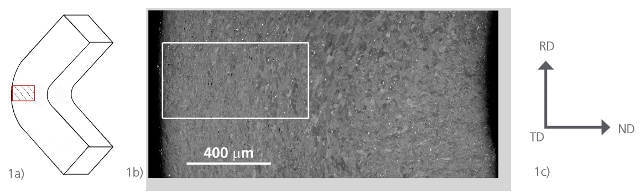
Figure 1. a) Schematic diagram of the bent sample b) SEM Image from the hashed area in Figure1a. The rectangular area in this image indicates the approximate region from where EBSD data was acquired for the heating experiment and c) shows the principle axes of the sheet. Image Credit: Oxford Instruments
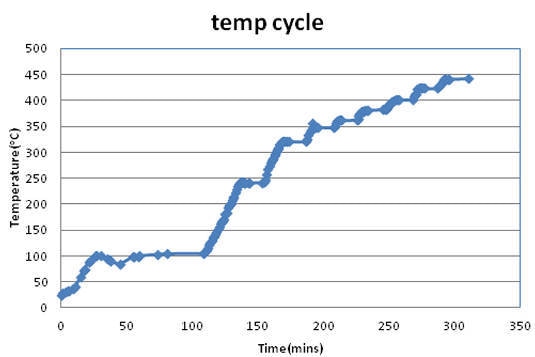
Figure 2. Temperature cycle used for the in-situ heating test. Image Credit: Oxford Instruments
Results and Discussion
A series of EBSD patterns, as well as IPF coloured and recrystallisation maps before and after heating to 440 ºC, are shown in Figures 4-6 respectively. These show that the initial, finer, elongated grains have been replaced with coarse grains.
However, complete recrystallisation has not been realised and many of the recrystallised grains are confined towards the highly strained regions at the sample surface, as expected. Some islands of unrecrystallised grains also persist within the recrystallised/recovered regions.
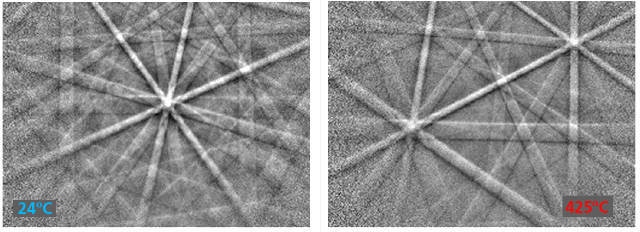
Figure 3. Typical EBSD patterns at 24 ºC (left) and 425 ºC (right). Image Credit: Oxford Instruments
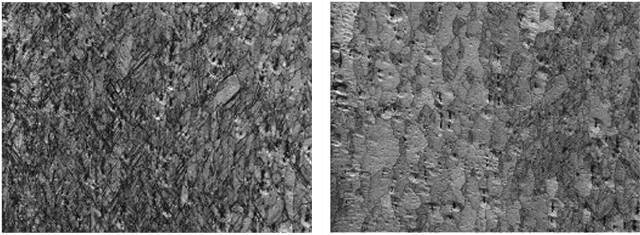
Figure 4. EBSD pattern quality maps before (left) and after (right) heating to 440 ºC. Image Credit: Oxford Instruments
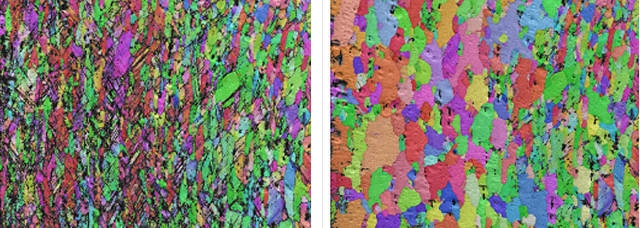
Figure 5. EBSD pattern IPF coloured maps before (left) and after (right) heating to 440 ºC. Image Credit: Oxford Instruments
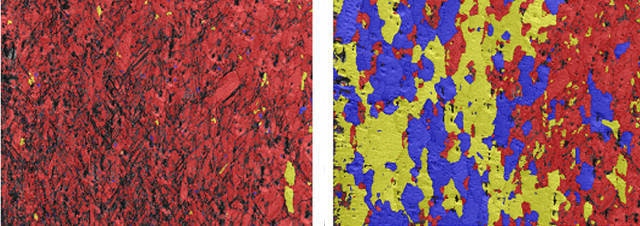
Figure 6. EBSD Recrystallisation fraction maps before (left) and after (right) heating to 440 ºC. (blue=recrystallised, yellow=sub-structured, red=deformed). Image Credit: Oxford Instruments
Figures 3-5 show the evolution of the microstructure, which was studied by collecting smaller higher resolution maps from the approximate area marked in Figure 7.
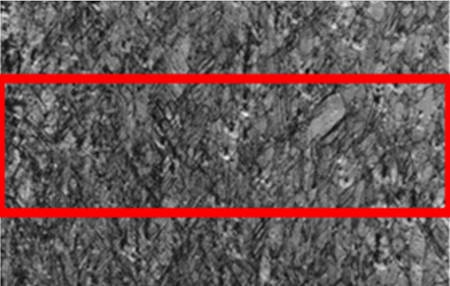
Figure 7. The rectangular area shows the location where higher resolution maps were collected to study evolution of the microstructure during in-situ heating. Image Credit: Oxford Instruments
Figures 8 a-g) show EBSD maps of local misorientaion, visualising the progression of recrystallisation during heating.
The recrystalised grains are shown in blue with minimal local misorientation. These images show that the first hint of recrystalised grains only appear after heating to 350ºC, as illustrated in Figure 8c.
While there are new grains in the region of greatest strain region towards the surface at the left of the images, there are also a few of these grains further away. This indicates that the strain distribution is heterogenous to some degree, potentially due to local variation of second phase particle densities.
As the temperature increases, fresh nucleation takes place simultaneously with growth of existing new grains. Grain growth appears to be slightly more rapid in the rolling direction; this could be due to the pinning effect from the second phase particles that exist in the sheet.
Events of particle simulated nucleation were not observed, as the individual particles are much smaller than the resolution of the maps.
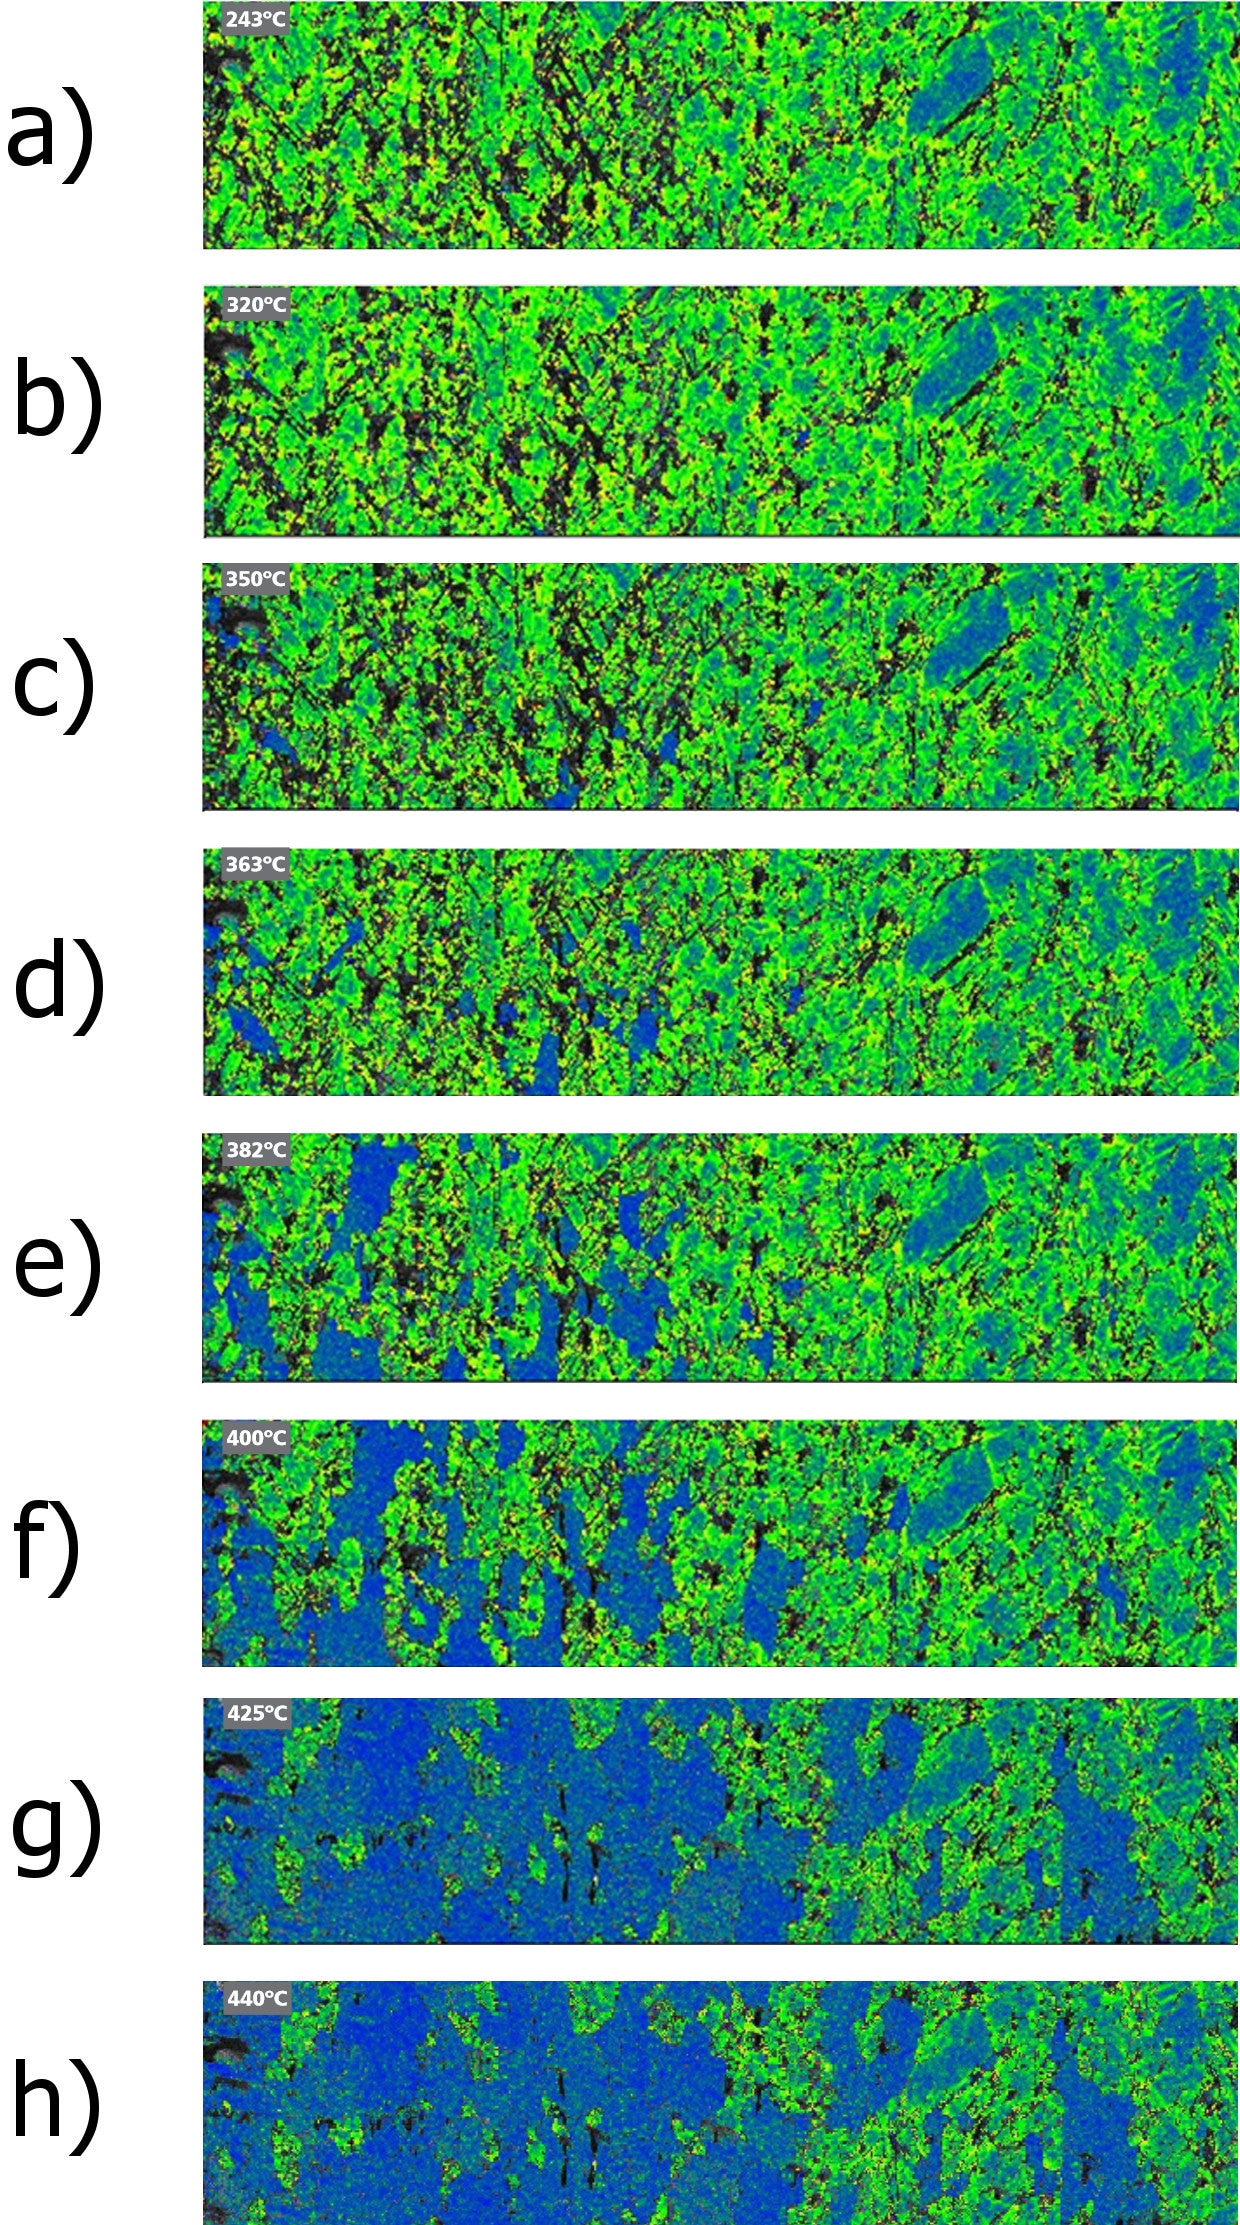
Figure 8. a-h) EBSD pattern IPF coloured maps after heating to 243, 320, 350, 363, 382, 400, 425 and 440 ºC respectively. Image Credit: Oxford Instruments
A graphical representation of the recrystallised, sub-structured (recovered) and deformed fraction as it alters with temperature is shown in Figure 9.
The change in grain orientation spread (GOS) over the heating cycle is shown in Figure 10. This plot also shows data for an Al 0.1 Mg alloy, where it is observed that the reduction in GOS for alloy 6063 is not as rapid as that found in an Al 0.1 Mg alloy.
This again shows that recovery and recrystallisation process are markedly influenced by second phase particles.
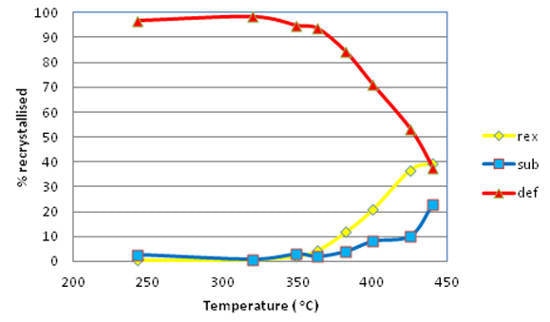
Figure 9. Plot of the recrystallised, sub-structured (recovered) and deformed fraction versus temperature. Image Credit: Oxford Instruments
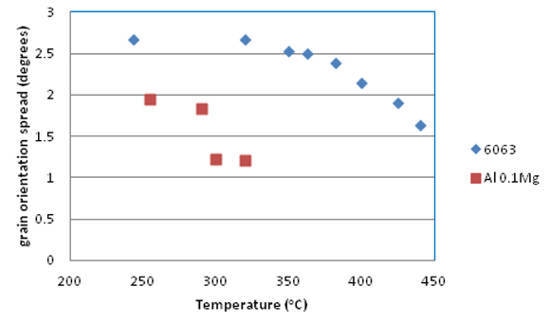
Figure 10. Plot of grain orientation spread versus temperature. Image Credit: Oxford Instruments
Comparison of the starting and the final microstructures after heating up to 440 ºC is shown in the EBSD IPF coloured maps in Figure 11. The lower diagram in Figure 11 additionally shows grain boundaries, >2º white and >8º black. The unrecrystallised fraction in Figure 10b is discernible from the white coloured low angle boundaries.
These maps clearly illustrate that large grains have replaced groups of fine deformed grains. Because the new grains nucleated in regions that had several differently oriented grains it has not been possible to show clearly if the new grains have any relationship with the deformed grain orientations.
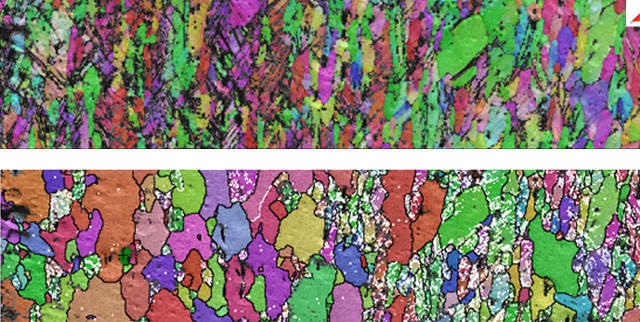
Figure 1. Top: EBSD IPF coloured maps of starting and the final microstructures after heating up to 440 ºC respectively. Bottom: EBSD IPF map additionally showing grain boundaries, where >2º=white and >8º=black. Image Credit: Oxford Instruments
However, from an initial inspection of the data set it was possible to discern that the first set of grain to nucleate were rotated Goss, Goss, rotated cube and cube, plus some Copper, Brass and S oriented grains. With the increase of temperature the rotated cube grains grew faster than the other orientations.
Existing deformed rotated Goss or Goss grains showed little propensity to recrystallise and resisted being consumed by neighbouring recrystalled grains. An example is labelled A in Figure 11.
In Figures 12 a and b are shown contoured pole figures after heating to 243 ºC and 440 ºC. These also show that the intensity of the rotated cube component has increased. However, owing to nearly 80 % recovered plus deformed components the deformation texture is still dominant.
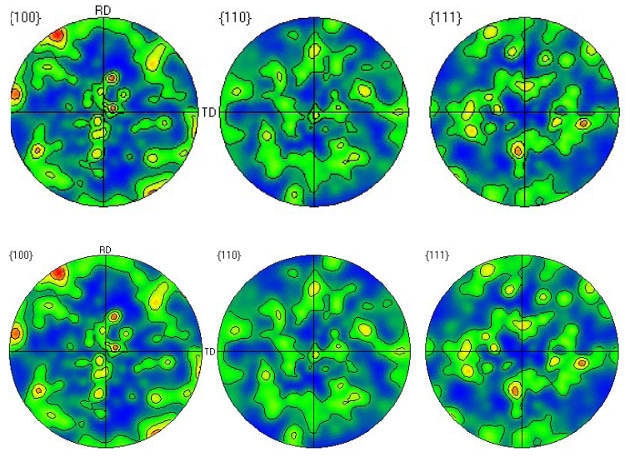
Figure 12. Set of {100}, {110} and {111} EBSD contoured pole figures after heating to 243 and 440 ºC respectively. Image Credit: Oxford Instruments
Conclusions
The feasibility of conducting in-situ heating experiments while acquiring crystallographic information using Oxford Instruments’ EBSD solution has been demonstrated.
The effect of second phase particle to slow recovery and recrystallisation processes has been observed. The propensity of Goss and rotated Goss grains to resist recrystallisation as well as their nucleation in the early stages of recrystallisation have been noted.
Rotated cube grain nucleation together with their higher growth rates results in the formation of dominant rotated cube texture in the tensile region of the bent sample.

This information has been sourced, reviewed and adapted from materials provided by Oxford Instruments.
For more information on this source, please visit Oxford Instruments.