In the chemical industry, manufacturing of polymers is one of the largest segments, with polystyrene alone manufactured in the billions of kilograms per year globally.1 Polymerization processes have become more complicated and often need tighter control of process parameters to meet the ever-increasing performance demands on polymeric materials. 2,3
Enabling mega volume processes that can consistently produce a quality product safely have increased the need for faster process analytical technologies (PAT) that improve real-time closed loop process control.
As spectroscopic techniques such as UV/Vis, fluorescence, NIR, IR, and Raman provide a number of benefits in the advanced process control in the hydrocarbon processing industries, they are widely adopted in a broad spectrum of manufacturing units.
Spectroscopic analyzers can make precise measurements of process chemistries with robust hardware, and require minimal maintenance because they have little or no moving parts. Compared to techniques such as gas chromatography, spectroscopy has fast analysis times, enhancing closed loop control situations by providing faster control response capabilities to upsets.
Spectroscopy methods are easier to multiplex and, in combination with speed of response, they provide considerable utility for the investment dollar over other analytical techniques. These are just a few of the several benefits offered by spectroscopic technologies.
Within the polymer processing segment of the chemical industry, such as the manufacture of polyethylene, polypropylene, or vinyls often involves slurries of feeds and polymers, stratified layers of differing densities, or highly turbulent gas liquid mixes.
The turbidity of these samples pose a challenge to spectroscopic techniques such as IR or NIR, which rely on a clear transmission or reflectance “path” of the analytical light through the samples. In the process analytical arena, Raman spectroscopy has emerged as a technology that is capable of addressing many of the obstacles facing spectroscopic implementation in the polymer processing industries.
Advantages of Raman
Raman spectroscopy is a technique based on light scattering and does not rely on a specific path for the analytical light, providing a number of benefits over other optical techniques in difficult sampling situations. Raman retains all of the benefits of multiplexing and goes a step further in that the absence of a defined path length eliminates analytical constraints prevalent in IR and NIR techniques.
Therefore, it is possible to measure more components at a single probe point. The spectrum is well defined on the wavelength axis with excellent peak separation, allowing users to extract more data with less chemometrically intensive calibration. The excellent peak separation enables rapid method development and transferability across instruments and operating scales.
Kaiser Optical Systems Inc., the established industry leader for on-line Raman measurements during polymer production1, has integrated proprietary optical technologies into a unified design, which is configurable to various installation environments from general purpose to explosive rated areas.
The design provides uniquely reproducible instrument-to-instrument performance, providing several advantages to users. The availability of a variety of interchangeable and process-optimized fiber optic sampling probes extends the capability of Raman analyzers, making servicing easier with a “plug and play” format.
The inherent reproducibility of the physical design delivers the same advantage to the spectral performance, enabling users to perform calibration transfer from instrument to instrument easily and also prevents calibration rework in the event of a detector or laser change.
Kaiser Optical Systems have successfully addressed key challenges for polymer applications including real-time monitoring of a melt composition 5, precise monitoring of the rate of monomer consumption and avoiding spectral interference from water in aqueous media, emulsion polymerizations,2 precisely analyzing chemical microstructure 3,4, precise but flexible monitoring of very high- performance materials 7, and acquiring detailed chemical information on the polymer backbone during a curing process 6.
This article discusses the capabilities of Kaiser Raman for polymer applications using three examples: polystyrene production using homogeneous and heterogeneous processes 8, high-impact polystyrene formation 9, and synthesis of polymer microgels 10. Although the examples presented in this article focus on polystyrene and associated processes, the measurement principles can be used in other polymerization processes including biopolymer processes.
Raman Spectroscopy of Styrene and Polystyrene
Polystyrene is a key polymeric material with many applications. Figure 1 shows a styrene monomer, which is a benzene derivative that polymerizes to a hydrocarbon chain with a phenyl group on every other carbon atom. Like NIR measurements, Raman measurements can be applied to make real-time process adjustments when evolving away from optimal operation conditions, ensuring a consistent and reliable process. This approach agrees well with Right First Time and Zero Defect initiatives.
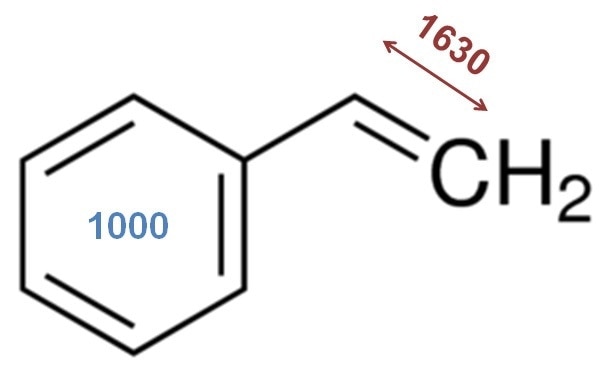
Figure 1. The chemical structure of styrene with two important Raman bands noted. The vinyl bond stretch in styrene is at ~ 1630 cm-1 and the benzene ring breathing mode at 1000 cm-1. As styrene polymerizes, the 1630 cm-1 band shows a reduced intensity. The 1000 cm-1 band is not affected by the polymerization and can be used as a reference peak. An intensity or area ratio of these bands is a straightforward univariate approach to tracking monomer consumption.
A Raman spectrum of polystyrene is shown in Figure 2, what should be noted about the spectrum is that the peaks correspond to known chemical moieties and are sharp, identifiable and measurable, enabling robust process monitoring and control.
In Figure 2, the band at 1000 cm-1 corresponds to a ring breathing mode of the benzene ring. As this aromatic ring remains unaffected by the polymerization reaction, this peak can be used as a useful reference for concentration measurements of reactants and polystyrene product.
Concentration measurements are performed by calculating the area or intensity ratio of distinctive reactant or product bands relative to the 1000 cm-1 band. Styrene polymerization is measured using the area or intensity ratio of the styrene vinyl bond at 1630 cm-1 to the 1000 cm-1 reference band. Raman-derived concentration predictions closely match measurements performed by gravimetry, but without any sample extraction.
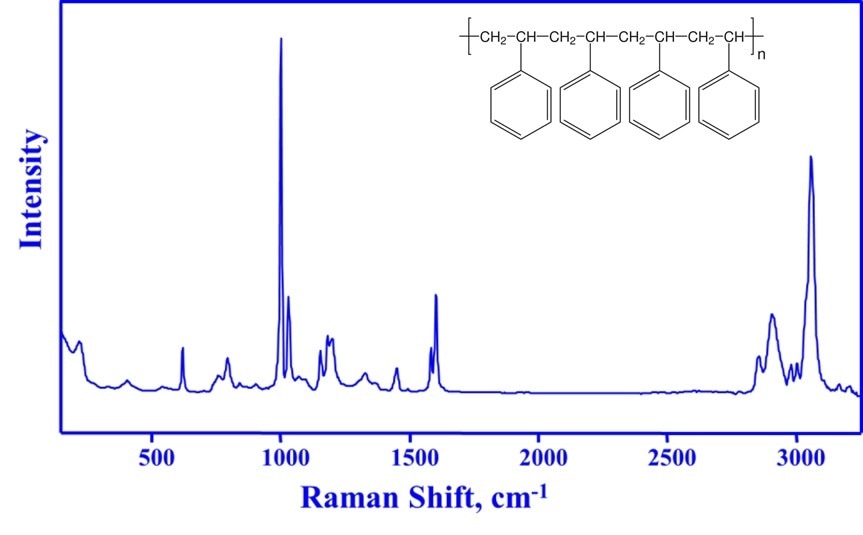
Figure 2. The chemical structure of polystyrene (insert) and its Raman spectrum. The sharp Raman bands of polystyrene correspond to specific chemical structures and can be used to identify, monitor and quantify the polymer.
Polystyrene Production using Homogeneous and Heterogeneous Processes
Polystyrene can be produced with a number of methods, the most common being free-radical polymerization. In this process, the addition of a low-temperature initiator to the styrene monomer in an organic solvent cleaves the monomer and opens up the vinyl bone to initiate the polymerization process.
As the polymerization process is highly exothermic, it is necessary to maintain the reactor within a tight temperature range in order to avoid autoacceleration.
Autoacceleration, also known as the Trommsdorf–Norrish effect or the gel effect, is the uncontrolled acceleration of a polymerization process, and is typically initiated by the rapid heating of the reaction vessel in a highly exothermic polymerization. Local increases in viscosity hinder termination reactions, causing uncontrolled acceleration of the polymerization process.
There are process efficiency and safety consequences of autoacceleration. For instance, the reaction mixture congeals into a solid mass, which often needs to be cut out of the reactor. This leads to wasted product and process down time.
Controlling the temperature, the concentration of styrene monomer, and the amount of solvent present in the reaction vessel is the key to eliminate autoacceleration and other process deviations. This can be achieved with predetermined parameters.
However, it is possible to control the process more consistently if the physical parameters and chemical contents of the reaction vessel are known throughout the process. Real-time process knowledge also enables making in-process corrections so that process upsets can be avoided.
Raman spectroscopy is well-suited for this task as it simultaneously generates molecular information on monomers, solvents, and polymer products in a quantifiable form.
Monitoring the polymerization process in real time enables intervention before gel formation. The work reported by Brun et al reveals that Raman spectroscopy could be part of a control strategy to eliminate process upsets to ensure the quality of a polymer product.8
These results specifically illustrate the utility of Raman spectroscopy for monitoring the polymerization of styrene into polystyrene. The results were able to be produced rapidly - within a matter of seconds - and they are in good agreement with the data obtained by classical gravimetric techniques that are proven to deliver good results but are also cumbersome and time-intensive.
High-Impact Polystyrene Formation
Coupling multiple probes with different sampling volumes to a single Kaiser RamanRXN2™ HYBRID analyzer is a powerful tool due to its ability to perform a multi-scale examination of the process. A Raman hybrid sampling approach provided a better understanding during polymerization of a spatially heterogeneous material 9. The preparation of high-impact polystyrene (HIPS) involves multiple steps, yielding a spatially heterogeneous graft copolymer (Figure 3).
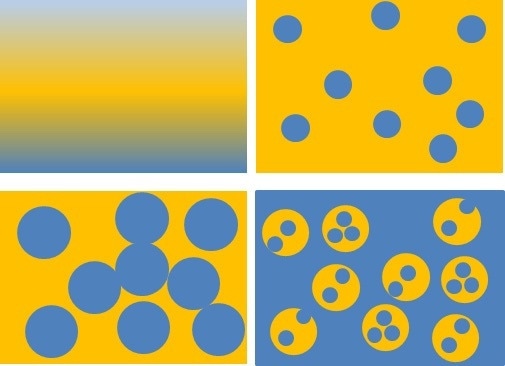
Figure 3. Cartoon representation of formation of high-impact polystyrene (HIPS). Blue color represents styrene/polystyrene (PS) and yellow color represents polybutadiene (PB). Reaction steps are from top left. Styrene and PB begin as miscible phases (top left). As styrene begins to polymerize, styrene/PS is immiscible and styrene/PS forms disperse nodules within a PB continuous phase (top right). Disperse styrene/PS nodules increase in volume as styrene polymerizes (bottom left) until phase inversion occurs (bottom right). The final product is a disperse phase containing PB nodules incorporated with PS inclusions, and a PS continuous phase. This morphology, called “salami morphology”, is affected by reaction physical and chemical parameters.
Micro-scale and macro-scale Raman measurements were obtained during the polymerization process. A Kaiser MR Probe featuring an immersion optic measured an approximate volume of 1 µm3 and was employed to measure styrene polymerization on the micro-scale.
A Kaiser non-contact sampling probe measured an approximate volume of 100 µm3 and was sensitive to macro-scale changes in the morphology of the copolymer, arising from phase changes and formation of nodules. There was a correlation between the Raman measurements and flow rheometry results. Raman measurements provided a molecular understanding to changes in the reaction medium viscosity.
Raman data could provide real-time process feedback on reactant addition rate, stirring rate, or temperature in order to consistently achieve the target copolymer morphology. While the paper by Brun et al discusses a laboratory application of a Raman hybrid sampling approach, embodiment of these principles can be incorporated into a process environment using Kaiser’s commercially available RamanRXN2™ HYBRID system shown in Figure 4.
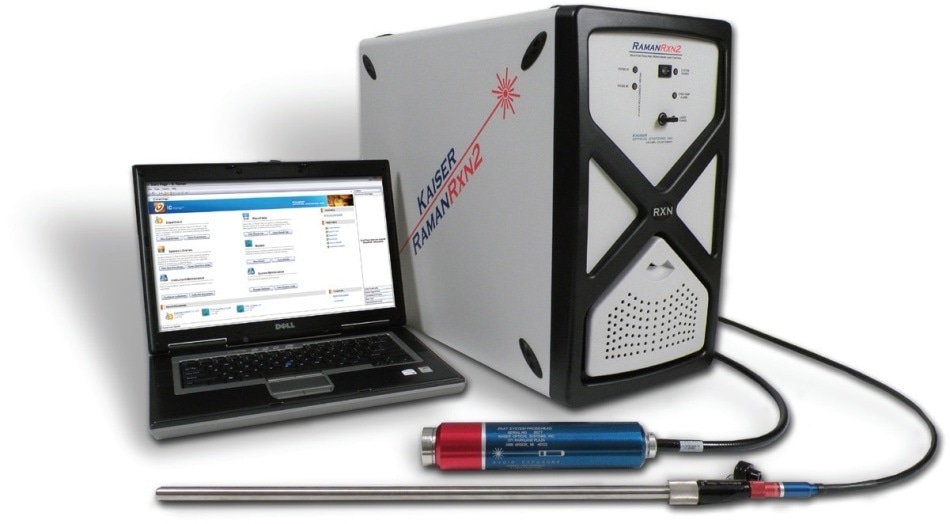
Figure 4. A process-compatible RamanRXN2™ HYBRID, equipped with a PhAT probe for large-volume sampling and an MR probe for traditional small spot sampling, provides measurements of the process on the micro-scale and the macro-scale. This approach is powerful in understanding hierarchical chemical and morphology properties of polymeric materials from the laboratory to manufacturing.
Polymer Microgels
Polymer microgels are tiny colloidal particles made of cross-linked polymers with a size range of 50 nm to 1 µm. They respond to external stimuli such as temperature and pH.11 The responsiveness is useful in a number of applications, including painting, catalysis, ink-jet printing, water treatment, and various medical and pharmaceutical applications.
Currently, microgels are produced at laboratory scale and there is great interest in developing industrial-scale processes to produce them in large quantities. However, various properties of microgels are vital for proper functioning, which include (co-)polymer composition, particle size, cross-linking density, and degree of swelling.
Controlling these properties to the target specifications requires a process analytical technology (PAT) that rapidly provides enough process knowledge to enable real-time control.
Offline GC and NMR are commonly used methods to monitor microgel synthesis, but they have several disadvantages. Most importantly, they require sample extraction and preparation, leading to long offset times that prevent their widespread adoption in real-time process analysis and control.
Infrared spectroscopy has also been used, but MIR has a large water background signal that often obscures polymer signal. These limitations are addressed by Raman spectroscopy by enabling fast, non-invasive sampling and minimal water signal. Meyer-Kirschner et al explains the use of Raman spectroscopy for real-time monitoring of microgel formation.10
Figure 5 shows the laboratory scale reaction configuration. Two Raman probes were inserted into the reaction, one with a long focal length and one with a short focal length, and coupled to a RamanRXN2™ analyzer. Immersion probes enabled direct measurements in the reaction mixture. Standard process-analytical software was used to input the Raman data into a chemometric model.
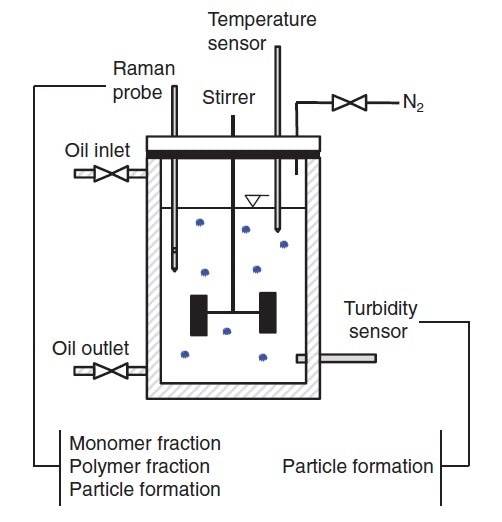
Figure 5. Schematic diagram of a basic system for monitoring and controlling the production of a polymer microgel. Reprinted from J. Meyer-Kirschner, et al. Appl. Spectrosc. 2016. 70(3): 416–426 ©2016 by SAGE Publications. Reprinted by permission of SAGE Publications, Ltd.
The authors addressed important issues in developing models of reactions that involve turbid media and non-linear kinetics. Certain polymerization reactions, including styrene polymerization, follow linear reaction kinetics, which can be monitored by following the change in the normalized peak intensity or area for the monomer.
However, a linear kinetic model does not always apply to fed-batch or continuous processes. Processes where monomer is added continuously, side reactions, or incomplete polymerizations are examples of non-linear polymerizations. Microgel syntheses also follow a non-linear reaction scheme.
There are other reaction attributes which are difficult to model using linear regression models. The spectral characteristics of the monomer and polymer may be very similar, and turbidity increases with microgel formation can lead to loss of signal intensity and a lower signal-to-noise ratio.
Modeling for overlapping spectral features and non-linear changes is expected to enhance the robustness and performance of a model. Meyer-Kirschner et al incorporated a hybrid model known as Indirect Hard Modeling (IHM), which included spectral profiles modeled using a “soft” model in combination with a “hard” model of mass balance and optical absorptivity.
Use of the IHM model enables simultaneous prediction of monomer concentration and microgel formation (Figure 6) and it reduced model error by a factor of two compared to a classical least squares regression. The IHM model was shown to be robust against variations in the particle size and temperature of the microgels.
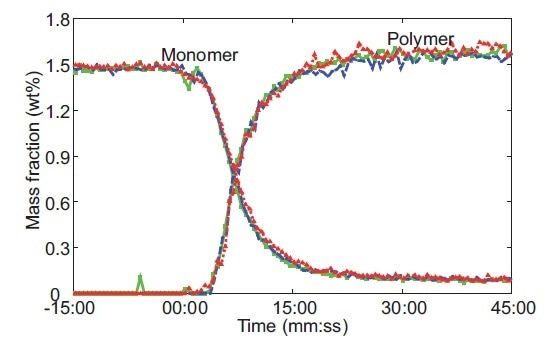
Figure 6. Raman-predicted monomer conversion and polymer formation from three replicates of a microgel reaction performed at 60 °C. The red, blue, and green colors represent data for an individual experiment. Reprinted from J. Meyer-Kirschner, et al. Appl. Spectrosc. 2016. 70(3): 416–426 ©2016 by SAGE Publications. Reprinted by permission of SAGE Publications, Ltd.
Conclusion
Raman spectroscopy provides a rapid, non-invasive technique of generating process knowledge that can be applied to real-time control of polymer processes ranging from laboratory synthesis of polymer microgels to large-scale polystyrene manufacturing.
Kaiser Raman combines process-hardened analyzers with fiber-optic sampling probes into a complete solution featuring robustness, reliability, and compatibility with leading process control software. Kaiser Optical Systems Inc. was established in 1979 based on holographic technology developed at the University of Michigan.
For the past two decades, the company has applied the measurement principles of Raman spectroscopy to manufacturing processes. It has proven application and financial successes in chemical and polymer manufacturing with demonstrated capabilities in enabling efficient processes that consistently produce a quality product safely.
References
1. Kaiser Optical Systems Inc. Kaiser Application Note 402: Raman Spectroscopy for Polymer Analysis.
2. A. Al-Khanbashi, M. Dhamdhere, M. Hansen. “Application of In-Line Fiber-Optic Raman Spectroscopy to Monitoring Emulsion Polymerization Reactions”. Appl. Spectrosc. Rev. 1998. 33(1–2): 115– 131. 10.1080/05704929808002627.
3. N. Everall, K. Davis, H. Owen, M.J. Pelletier, J. Slater. “Density Mapping in Poly(Ethylene Terephthalate) Using a Fiber-Coupled Raman Microprobe and Partial Least-Squares Calibration”. Appl. Spectrosc. 1996. 50(3): 388–393. 10.1366/0003702963906258.
4. Kaiser Optical Systems Inc. Kaiser Application Note 403: Microstructural Analysis of Polybutadienes.
5. Kaiser Optical Systems Inc. Kaiser Application Note 404: In-line Monitoring of Ethylene Vinyl Acetate Copolymer with Raman Spectroscopy.
6. Kaiser Optical Systems Inc. Kaiser Application Note 405: Simultaneous DSC–Raman Analysis of the Curing of an Epoxy Thermoset.
7. Kaiser Optical Systems Inc. Kaiser Application Note 406: Monitoring and Control of a Semi-Batch Polymerization with Raman Spectroscopy.
8. N. Brun, I. Youssef, M.-C. Chevrel, D. Chapron, C. Schrauwen, S. Hoppe, et al. “In situ monitoring of styrene polymerization using Raman spectroscopy. Multi-scale approach of homogeneous and heterogeneous polymerization processes”. J. Raman Spectrosc. 2013. 44(6): 909–915. 10.1002/jrs.4279.
9. N. Brun, M.-C. Chevrel, L. Falk, S. Hoppe, A. Durand, D. Chapron, et al. “Contribution of Raman Spectroscopy to In Situ Monitoring of a High-Impact Polystyrene Process”. Chem. Eng. Technol. 2014. 37(2): 275–282. 10.1002/ceat.201300421.
10. J. Meyer-Kirschner, M. Kather, A. Pich, D. Engel, W. Marquardt, J. Viell, et al. “In-line Monitoring of Monomer and Polymer Content During Microgel Synthesis Using Precipitation Polymerization via Raman Spectroscopy and Indirect Hard Modeling”. Appl. Spectrosc. 2016. 70(3): 416–426. 10.1177/0003702815626663.
11. J.B. Thorne, G.J. Vine, M.J. Snowden. “Microgel applications and commercial considerations”. Colloid Polym. Sci. 2011. 289(5–6): 625. 10.1007/s00396-010-2369-5.

This information has been sourced, reviewed and adapted from materials provided by Kaiser Optical Systems, Inc.
For more information on this source, please visit Kaiser Optical Systems, Inc.