Oct 18 2021
Orthopedic implant surgeries including artificial joint replacement, spinal instrumentation, and fracture repair are becoming frequent. While such procedures can improve the quality of life, they have risks of complications. A paper by Sasamoto, T et al. expands on this; this article takes a closer look at that paper.
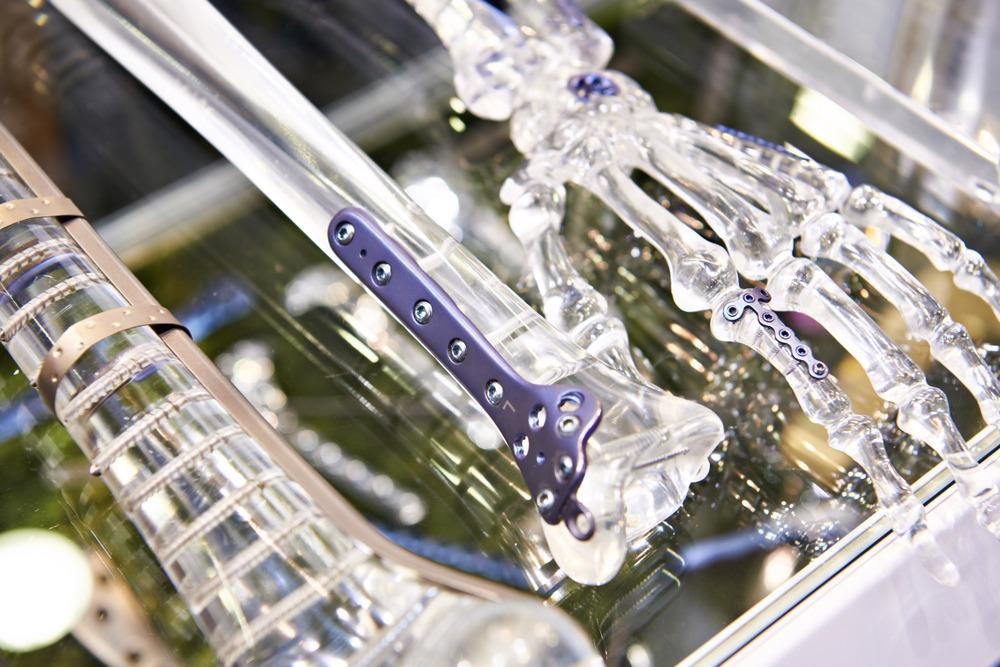
Image Credit: Sergey Ryzhov/Shutterstock.com
One serious issue is postoperative peri-implant infection. Incident rates are notable, and various techniques for applying gold, silver, iodine, or antibiotics like gentamycin or vancomycin to the metal surface of the implant are being studied with the aim of preventing peri-implant infections.
Diamond-like carbon (DLC) is a reference term for carbon thin films possessing high hardness, electrical insulation, and infrared transmission. The combination of F-DLC with fluorine has an anticoagulant effect, finding application in clinical settings and blood vessel stents. The researchers reported excellent antibacterial properties expressed by coating.
An important cause of concern is the impact on osteogenesis caused by the DLC coating. The researchers investigated the effects of F-DLC coating on osteogenesis meanwhile making a comparison to uncoated titanium alloy.
This article measures the release of F-ions from the F-DLC coating. F-ions can increase both direct cytotoxicity and metabolic toxicity and are also capable of bonding with calcium and magnesium in the body to cause hypocalcemia or hypomagnesemia.
Methodology
The study investigated the effects of F-DLC coated titanium alloy in vivo osteogenesis with the approval of the Animal Research Ethics Review Board. The experiment focused on local bone response rather than the system response.
The test specimens were of Ti-6Al-4V metal alloy, comprising 90% titanium, 6% aluminum, 4% vanadium by a mass fraction. The high bio-affinity of the alloy enables broad application potential in bone-anchoring implants.
Radiofrequency inductively coupled plasma chemical vapor deposition (CVD) technique was used to lay three layers of coating. The respective layers are silicon carbide (SiC), DLC coating (a-C:H structure), and F-DLC coating (23 at.%F+a-C:H:F structure).
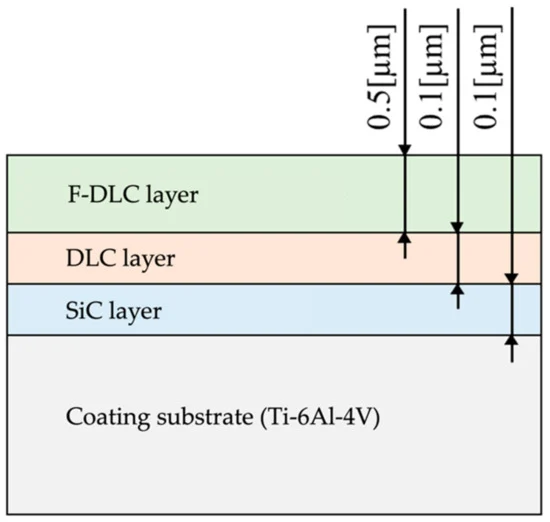
Figure 1. Coating thickness and structure. Image Credit: Sasamoto et al., 2021
The test pieces were shaped into solid columns 5 mm in diameter and 20 mm in length. Parallel slits 0.5 mm wide and 2 mm deep were made in each column along the short axis in 12 locations at 1-mm intervals.
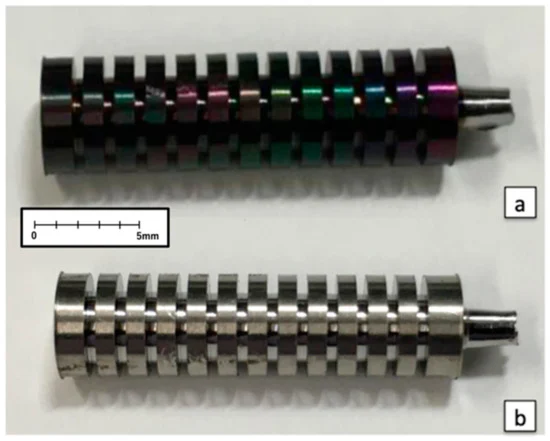
Figure 2. (a) Implant coated with fluorinated diamond-like carbon (F-DLC); (b) Control implant without F-DLC coating. Image Credit: Sasamoto et al., 2021
After administering anesthesia to dogs, following other standard procedures, a 10-cm skin incision was made in the anterior lateral margin of the femur. The initial cut was made between the quadriceps femoris muscle and tensor fascia lata muscle.
The diaphysis was exposed by placing forward traction on the quadriceps femoris muscle. A ϕ5.0 mm drill was used to create holes at 3 sites along the long axis in the diaphysis region of the femur (the center of the diaphysis, 2 cm proximal to the center, and 2 cm distal to the center).
The diameter of each hole was then enlarged using a ϕ5.1 mm reamer. During this process, the drill and reamer were cooled continuously to minimize irritation to the bone. More saline solution was used to remove the residual tissue. A total of six implants from Group F or Group C were inserted.
After 4, 8, and 12 weeks of the implantation, the animals were sacrificed by intravenous injection of KCL, and the specimens were collected.
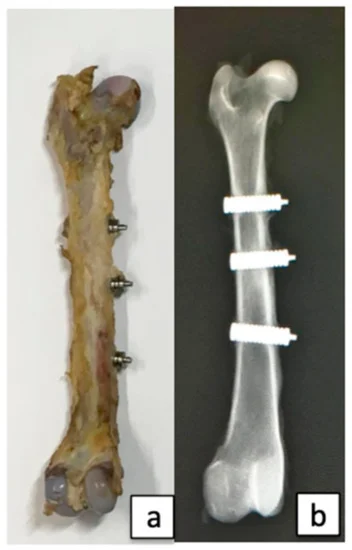
Figure 3. (a) Collected femur; (b) Radiograph of the femoral bone. Image Credit: Sasamoto et al., 2021
At every interval, eight femurs were collected. Double staining was done and calcein was injected subcutaneously before collecting the bone specimens. Under fluorescence, bones calcified before and after implantation were differentiated.
Then, the bones were fixed with 70% ethanol and cut into three pieces. All pieces were polished and stained with Villanueva Osteochrome Bone Stain to create cross-sectional femoral specimens. A total of 72 specimens were created with 24 specimens for each collection week.
Natural light, polarized light, and fluorescent light were used to examine the cortical bone that most affects the bone union. Fluorescence light was used to evaluate the maturity of newly formed tissue.
Bone histomorphometry was then applied to measure eight parameters, namely, bone mass (%), trabecular thickness (µm), osteoclast number (N/mm), resorption area (%), osteoblast number (N/mm), osteoid area (%), calcification rate (µm/day), the annual rate of bone formation (µm/year).
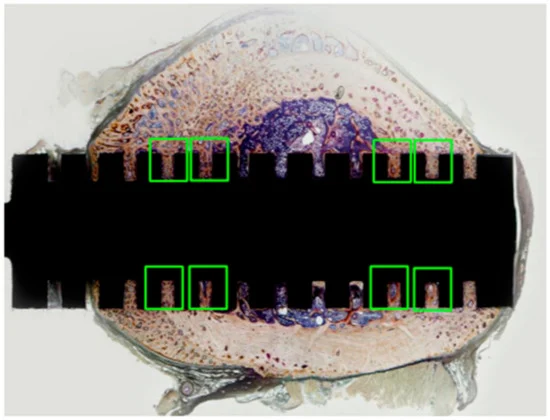
Figure 4. Cross-section of polished non-demineralized femur specimen (whole specimen). Pathological examination and bone histomorphometric assessment were focused on in the green-boxed areas, where the cortical bone contacted the slit portion of the implant because the bone formation was expected to be more active in those areas. Image Credit: Sasamoto et al., 2021
The F-ion elution was confirmed using solid round columns of 25 mm diameter and 5 mm thickness and polished to a mirror finish (Ra = 0.1 µm). Testing was performed by lanthanum–alizarin complex one absorption spectrometry complying methods.
The coating was accordingly applied, and to mimic in vivo conditions, immersion was conducted in the darkroom protected from ultraviolet rays. A temperature of 37 °C ± 0.2 °C was set to maintain an ideal state. Test pieces were left to stand in normal saline solution within a desiccator within a thermostatic chamber for a certain time.
The soaking solution was later used as a test solution with pieces soaked for 2 weeks, 4 weeks, and 8 weeks, with testing done on three instances.
The student’s t-test was used for statistical analysis, to compare Group F and Group C for F ions elution. All data were shown as mean values for each group ± standard deviation. The significance level was set at p < 0.05. Results were graphed with standard deviations.
Results
Figure 5 depicts the observation under natural light. At week 4, the formation of fibrous bone tissue in both groups was confirmed. At week 8, fibroblasts and fibrous osteoids were visible in Group C, while in Group F, trabeculae were forming deep in the slits and no immature cells were visible. At week 12, there was a formation of trabeculae deep in the slits in Group C but the absence of immature cells was noticed. Trabeculae were denser in Group F than in Group C.
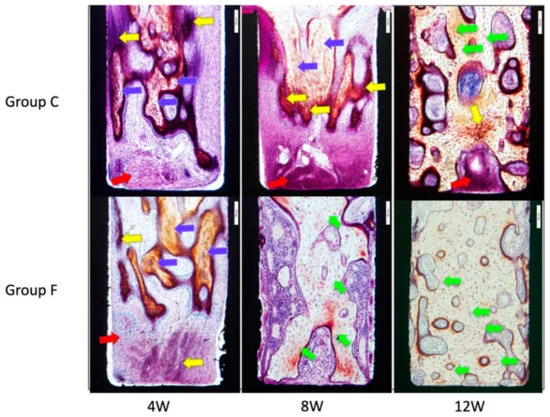
Figure 5. Microscopic images of inner surfaces of the slits under natural light. Yellow arrows indicate fibrous osteoids, blue arrows are fibrous bones, red arrows are fibroblasts, and greenish-yellow arrows indicate lamellar bones. Image Credit: Sasamoto et al., 2021
Figure 6 shows the observation of the specimen under polarized light, where the Lamellar bone is clearly visible. At week 8, lamellar bone and osteons were visible, but not in Group C. At week 12, more lamellar bone and osteons were visible than Group C.
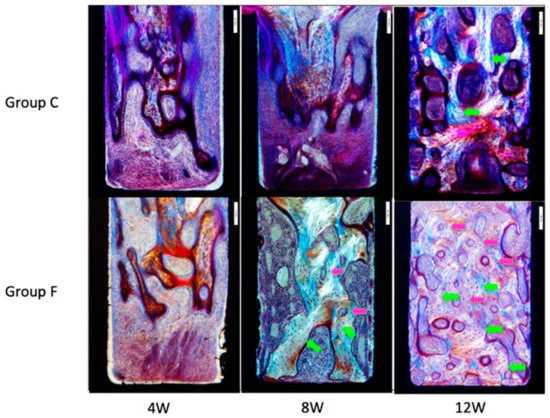
Figure 6. Microscopic images of inner surfaces of slits under polarized light. Greenish-yellow arrows indicate lamellar bone, and pink arrows indicate osteons. Lamellar bone and osteons were visible in Group F at Week 8. At Week 12, Group F showed more lamellar bone and more osteons than Group C. Image Credit: Sasamoto et al., 2021
In Figure 7, the observations under the fluorescent light of the specimen are presented. Newly formed bone tissue with calcein green was identified. In both F and C groups, the calcein-labeled areas increased from week 8 to week 12. At Week 12, double labeling of specimens was noted in Group F.
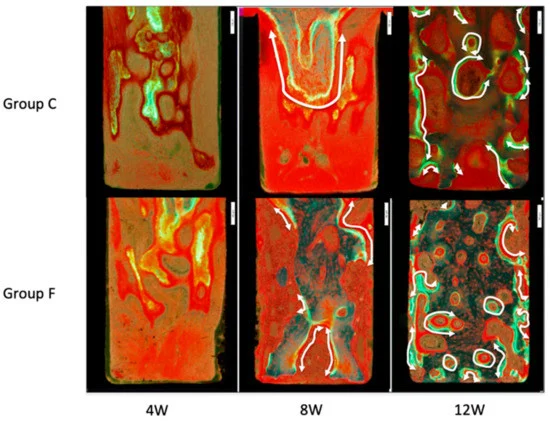
Figure 7. Microscopic images of inner surfaces of slits under fluorescent light. Newly formed bone tissue is identified with calcein-green labeling. White arrows show regions of double labeling. At Week 12, more bone was formed in Group F than in Group C. Image Credit: Sasamoto et al., 2021
The results of bone tissue morphometry are shown in Figure 8a–h and Table 1. Mean bone volume/tissue volume ± SD was remarkably increased in Group F. Mean trabecular thickness ± SD was significantly increased in Group F. The mean number of osteoclasts per bone surface ± SD saw a significantly greater decrease in Group F.
Mean eroded surface/bone surface ±SD saw a significantly greater decrease in Group F. At 8 weeks the ratio of bone formation rate/tissue volume was significantly greater in Group F.
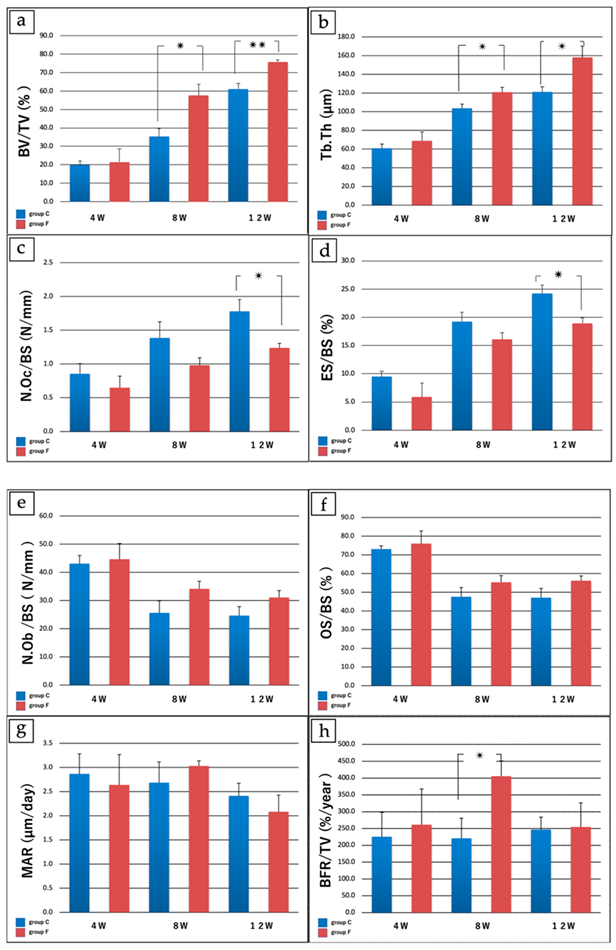
Figure 8. Results of bone histomorphometry. (a) Bone volume/tissue volume (%). At Week 4 no significant differences were noted between groups. At Week 8 bone volume/tissue volume (%) was 35.37 ± 8.70 in Group C vs. 57.53 ± 12.4 in Group F (p < 0.05), and at Week 12 was 61.17 ± 2.12 in Group C vs. 75.77 ± 5.88 in Group F (p < 0.005), with a significantly greater increase in Group F. (b) Trabecular thickness (µm). At Week 4, no significant differences were noted between groups. At Week 8, the trabecular thickness was 103.71 ± 8.8 µm in Group C vs. 120.87 ± 10.5 µm in Group F (p < 0.05), and at Week 12 was 121.19 ± 11.1 µm in Group C vs. 158.11 ± 24.2 µm in Group F (p < 0.05), with a significantly greater increase in Group F. (c) Number of osteoclasts/bone surface length (N/mm). At Week 4 and Week 8, no significant differences were noted between groups. The number of osteoclasts/bone surface length was 1.78 ± 0.35/mm in Group C vs. 1.28 ± 0.13 /mm in Group F (p < 0.05), with a significantly greater decrease in Group F. (d) Eroded surface/bone surface (%). At Week 4 and Week 8, no significant differences were noted between groups. At Week 12, eroded surface/bone surface (%) was 24.19 ± 3.03 in Group C vs. 18.94 ± 1.98 in Group F (p < 0.05), with a significantly greater decrease in Group F. (e) Number of osteoblasts/bone surface length (N/mm); (f) Osteoid surface/bone surface (%). (g) Mineral apposition rate (µm/day). (h) Bone formation rate/tissue volume (%/year). For (e–g), no significant differences were found between Group C and Group F at any time point. For (h), the ratio of bone formation rate/tissue volume at 8 weeks was 220.1 ± 119.08 %/year in Group C vs. 405.47 ± 92.29 %/year in Group F (p < 0.05), with a significantly greater increase in Group F. * p < 0.05; **p < 0.005 for (a–d,h). Image Credit: Sasamoto et al., 2021
Table 1. Results of bone histomorphometry. Source: Sasamoto et al., 2021
| |
4 W (Groups
C vs. F) |
8 W (Groups
C vs. F) |
12 W (Groups
C vs. F) |
| a: Bone volume/Tissue volume (%) |
19.89 ± 4.51 vs. 21.51 ± 14.1 |
35.37 ± 8.70 vs.
57.53 ± 12.4 * |
61.17 ± 2.12 vs. 75.77 ± 5.88 ** |
| b: Trabecular thickness (μm) |
60.71 ± 9.10 vs. 68.92 ± 18.8 |
103.71 ± 8.8 vs. 120.87 ± 10.5 * |
121.19 ± 11.1
158.11 ± 24.2 * |
| c: No. osteoclasts/Bone surface (N/mm) |
0.85 ± 0.30 vs. 0.65 ± 0.34 |
1.39 ± 0.48 vs.
0.98 ± 0.22 |
1.78 ± 0.35 vs. 1.28 ± 0.13 * |
| d: Eroded surface/Bone surface (%) |
9.47 ± 1.87 vs. 5.88 ± 4.89 |
19.27 ± 3.23 vs. 16.08 ± 2.36 |
24.19 ± 3.03 vs. 18.94 ± 1.98 * |
| e: No. osteoblasts/Bone surface (N/mm) |
43.10 ± 5.78 vs. 44.68 ± 11.11 |
25.62 ± 8.51 vs. 34.15 ± 5.34 |
24.66 ± 6.35 vs.
31.08 ± 4.90 |
| f: Osteoid surface/bone surface (%) |
73.10 ± 3.40 vs. 76.00 ± 13.50 |
47.60 ± 9.84 vs. 55.31 ± 7.14 |
47.10 ± 9.90 vs. 56.17 ± 5.14 |
| g: Mineral apposition rate (μm/day) |
4.87 ± 0.83 vs. 2.64 ± 1.25 |
2.69 ± 0.86 vs.
3.03 ± 0.21 |
2.41 ± 0.52 vs. 2.08 ± 0.69 |
| h: Bone formation rate/bone volume (%/year) |
225.50 ± 145.50 vs. 261.67 ± 211.94 |
220.91 ± 119.08 vs. 405.47 ± 92.29 * |
247.09 ± 73.64 vs. 254.80 ± 142.83 |
* p < 0.05; ** p < 0.005.
The values of the immersion period (weeks) for test pieces and fluoride ion elution volume per unit area are presented in Figure 9. The number of fluoride ions has increased over time.
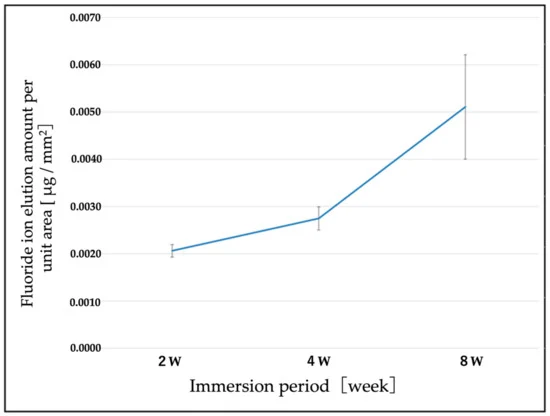
Figure 9. Changes over time in the amount of fluorine elution per unit area. The concentration of F ions tended to increase over time. Image Credit: Sasamoto et al., 2021
Discussion
The study established a comparison between traditional titanium alloy implants and F-DLC-coated titanium alloy implants to determine the effects of F-DLC coating on bone formation in vivo. The findings show the bone union was more accelerated with F-DLC coated implants than with non-coated titanium alloy implants.
It was also observed the bone union was much promoted by the DLC coating without fluorine. Further, the supplemental experiment affirmed the elution of F ions from the F-DLC-coating over time. At week 12, there was a decrease in osteoclasts, due to the less solution of F ions.
Excessive or prolonged inflammation was related to extended cell and callus proliferation. As per the study, the selected F ions formed sodium fluoride leading to anti-inflammatory action that shortened the duration of inflammation during the early bone union.
The implants were tested only for 8 weeks. The study was performed on beadle dogs, but human studies are also required. Even with these limitations, the study affirmed the antibacterial properties of the F-DLC coating.
Conclusions
The study unveiled the promotion of bone growth by alloy with F-DLC coating, and the alloy was eluted at a level well lower than the reported toxic level of fluoride. Considering the antibacterial and bone union-promoting characteristics, F-DLC exhibits promise as a coating material for bone implants.
Journal Reference:
Sasamoto, T., Kawaguchi M., Yonezawa K., Ichiseki T., Kaneuji A., Shintani K., Yoshida A., Kawahara N. (2021) Antibacterial Fluorinated Diamond-Like Carbon Coating Promotes Osteogenesis—Comparison with Titanium Alloy. Applied Sciences. Available at: doi.org/10.3390/app11209451.
References and Further Reading
Davne, S H & Myers, D L (1992) Complications of lumbar spinal fusion with transpedicular instrumentation. Spine, 17 (Suppl. 6), pp. S184–S189. doi.org/10.1097/00007632-199206001-00021.
Sponseller, P. D., et al. (2000) Deep wound infections after neuromuscular scoliosis surgery: A multicenter study of risk factors and treatment outcomes. Spine, 25, pp. 2461–2466. doi.org/10.1097/00007632-200010010-00007
Sperling, J. W., et al. (2001) Infection after shoulder arthroplasty. Clinical Orthopaedics and Related Research, 382, pp. 206–216. doi.org/10.1097/00003086-200101000-00028.
Minnema, B. et al. (2004) Risk factors for surgical-site infection following primary total knee arthroplasty. Infection Control & Hospital Epidemiology, 25, pp. 477–480. doi.org/10.1086/502425.
Bengtson, S & Knutson, K. et al. (1991) The infected knee arthroplasty. A 6-year follow-up of 357 cases. Acta Orthopaedica Scandinavica, 62, pp. 301–311. doi.org/10.3109/17453679108994458.
Hill, G E & Droller, D G (1989) Acute and subacute deep infection after uncemented total hip replacement using antibacterial prophylaxis. Orthopedic Reviews, 18, pp. 617–623. doi.org/10.3390/antibiotics9080495.
Wymenga, A. B., et al. (1992) Perioperative factors associated with septic arthritis after arthroplasty. Prospective multicenter study of 362 knee and 2,651 hip operations Acta Orthopaedica Scandinavica, 63, pp. 665–671. doi.org/10.1080/17453679209169732.
Phillips, C. B., et al. (2003) Incidence rates of dislocation, pulmonary embolism, and deep infection during the first six months after elective total hip replacement. The Journal of Bone and Joint Surgery, 85, pp. 20–26. doi.org/10.2106/00004623-200301000-00004.
Lucke, M., et al. (2003) Gentamicin coating of metallic implants reduces implant-related osteomyelitis in rats. Bone, 32, pp. 521–531. doi.org/10.1016/S8756-328200050-4.
Antoci, V., et al. (2007) Vancomycin bound to Ti rods reduces periprosthetic infection: Preliminary study. Clinical Orthopaedics and Related Research, 461, pp. 88–95, doi.org/10.1097/BLO.0b013e318073c2b2.
Neut, D. A., et al. (2015) Biodegradable gentamicin-hydroxyapatite-coating for infection prophylaxis in cementless hip prostheses. European Cells & Materials, 2, pp. 42–55, doi.org/10.22203/eCM.v029a04.
Noda, I., et al. (2009) Development of novel thermal sprayed antibacterial coating and evaluation of release properties of silver ions. Journal of Biomedical Materials Research, Part B, 89B, pp. 456–465, doi.org/10.1002/jbm.b.31235.
Funao, H., et al. (2016) A novel hydroxyapatite film coated with ionic silver via inositol hexaphosphate chelation prevents implant-associated infection. Scientific Reports, 6, p. 23238, doi.org/10.1038/srep23238.
Ando, Y., et al. (2010) Calcium phosphate coating containing silver shows high antibacterial activity and low cytotoxicity and inhibits bacterial adhesion. Materials Science and Engineering C, 30, pp. 175–180, doi.org/10.1016/j.msec.2009.09.015.
Zainali, K., et al. (2009) Effects of gold coating on experimental implant fixation. Journal of Biomedical Materials Research. A, 88, pp. 274–280, doi.org/10.1002/jbm.a.31924.
Shirai, T., et al. (2011) Antibacterial iodine-supported titanium implants. Acta Biomater, 7, pp. 1928–1933, doi.org/10.1016/j.actbio.2010.11.036.
Stuart, B. W., et al. (2021) New solutions for combatting implant bacterial infection based on silver nano-dispersed and gallium incorporated phosphate bioactive glass sputtered films: A preliminary study. Bioactive Materials, 8, pp. 325–340, doi.org/10.1016/j.bioactmat.2021.05.055.
Bee, S.-L., et al. (2021) Synthesis of silver nanoparticle-decorated hydroxyapatite nanocomposite with combined bioactivity and antibacterial properties. Journal of Materials Science: Materials in Medicine, 32, pp. 106, doi.org/10.1007/s10856-021-06590-y.
Aisenberg, S & Chabot, R (1971) Ion-beam deposition of thin films of diamondlike carbon. Journal of Materials Science: Materials in Medicine, 42, p. 2953, doi.org/10.1063/1.1660654.
Saito, T., et al. (2005) Antithrombogenicity of fluorinated diamond-like carbon films. Diamond and Related Materials, 14, pp. 1116–1119, doi.org/10.1016/j.diamond.2004.09.017.
Yonezawa, K., et al. (2020) Evaluation of antibacterial and cytotoxic properties of a fluorinated diamond-like carbon coating for the development of antibacterial medical implants. Antibiotics, 9, p. 495. doi.org/10.3390%2Fantibiotics9080495.
Mine, Y., et al. (2014) Impact of biomimetic diamond-like carbon coated titanium on osteoblast and osteoclast differentiation in vitro. Journal of Photopolymer Science and Technology. 2014, 27, pp. 373–378. doi.org/10.2494/photopolymer.27.373.
Mine, Y. et al. (2012) Biomimetic diamond-like carbon coated titanium inhibits RANKL-dependent osteoclast differentiation in vitro. Journal of Photopolymer Science and Technology, 25, pp. 523–528. doi.org/10.2494/photopolymer.25.523.
Shuto, T., et al. (2016) Differentiation of osteoblast and osteoclast cells on hydrogenated-tetrahedral amorphous carbon coated titanium. Journal of Photopolymer Science and Technology, 29, pp. 413–418. https://doi.org/10.2494/photopolymer.29.413.
Japanese Industrial Standard: JIS K 0102:2016. Testing Methods for Industrial Wastewater; General Incorporated Association Industrial Environment Management Association; Japanese Standards Association: Tokyo, Japan, 2016; pp. 108–114.
Kawaguchi, M., et al. (2021) Bone formation at Ti-6Al-7Nb scaffolds consisting of 3D honeycomb frame and diamond-like carbon coating implanted into the femur of beagles. Journal of Biomedical Materials Research, 109, pp. 1283–1291, doi.org/10.1002/jbm.b.34789.
Farley, J. R., et al. (1983) Fluoride directly stimulates proliferation and alkaline phosphatase activity of boneforming cells. Science, 222, pp. 330–332. doi.org/10.1126/science.6623079.
Marie, P. J., et al. (1992) Stimulation of bone formation in osteoporosis patients treated with fluoride associated with increased DNA synthesis by osteoblastic cells in vitro. Journal of Bone and Mineral Research, 7, pp. 103–113. doi.org/10.1002/jbmr.5650070115.
Khokher, M A & Dandona, P (1990) Fluoride stimulates [3H]thymidine incorporation and alkaline phosphatase production by human osteoblasts. Metabolism, 39, pp. 1118–1121. doi.org/10.1016/0026-0495(90)90081-M.
Wergedal, J. E., et al. (1988) Fluoride and bovine bone extract influence cell proliferation and phosphatase activities in human bone cell cultures. Clinical Orthopaedics and Related Research, 233, pp. 274–282. doi.org/10.1097/00003086-198808000-00034.
Taves, D R (1970) New approach to the treatment of bone disease with fluoride. Federation Proceedings, 29, pp. 1185–1187.
Messer, H. H., et al. (1973). Fluoride, parathyroid hormone and calcitonin: Effects on metabolic processes involved in bone resorption. Calcified Tissue Research, 13, pp. 227–233. doi.org/10.1007/BF02015412.
McCann, H. G., et al. (1953) Reaction of fluoride ion with hydroxyapatite. Journal of Biological Chemistry, 201, pp. 247–259.
Liu, S., et al. (2019) Fluorine-contained hydroxyapatite suppresses bone resorption through inhibiting osteoclasts differentiation and function in vitro and in vivo. Cell Proliferation, 52, p. e12613. doi.org/10.1111/cpr.12613.
Rich, C & Feist, E (1970) The Action of Fluoride on Bone. In Fluoride in Medicine; Vischer, T., Ed.; Hans Huber Publications. Bern, Switzerland, pp. 70–87. doi.org/10.3390/app11209451.
Hedlund, L R & Gallagher, J C (1989) Increased incidence of hip fracture in osteoporotic women treated with sodium fluoride. Journal of Bone and Mineral Research, 4, pp. 223–225. doi.org/10.1002/jbmr.5650040214.
Varughese, K & Moreno, E C (1981) Crystal growth of calcium apatites in dilute solutions containing fluoride. Calcified Tissue International, 33, pp. 431–439. doi.org/10.1007/bf02409467.
Eanes, E D & Reddi, A H (1979) The effect of fluoride on bone mineral apatite. Metabolic Bone Disease and Related Research, 2, pp. 3–10.
Moreno, E. C., et al. (1977) Physicochemical aspects of fluoride-apatite systems relevant to the study of dental caries. Caries Research, 11, pp. 142–171. doi.org/10.1159/000260299.
Bhawal, K. U., et al. (2020) Treatment with low-level sodium fluoride on wound healing and the osteogenic differentiation of bone marrow mesenchymal stem cells. Dental Traumatology, 36, pp. 278–284, doi:10.1111/edt.12532.
Brown, J. H., et al. (1972) Anti-inflammatory Activity of Sodium Fluoride. Archives Internationales de Pharmacodynamie et de Therapie, 195, pp. 361–371.
Lee, H J & Choi, C H (2015) Anti-inflammatory effects of bamboo salt and sodium fluoride in human gingival fibroblasts—An in vitro study. Kaohsiung. International Journal of Medical Sciences, 31, pp. 303–308. doi.org/10.1016/j.kjms.2015.03.005.
Institute of Medicine (US) Standing Committee on the Scientific Evaluation of Dietary Reference Intakes (1997) Dietary Reference Intakes for Calcium, Phosphorus, Magnesium, Vitamin D, and Fluoride; National Academies Press: Washington, DC, USA; pp. 288–313. doi.org/10.17226/5776.