Sugar manufacturing is a highly water-intensive process that requires water in almost every unit of operation. For example, to maximize juice extraction, water must be sprayed on sugarcanes during the milling process.
Steam turbines propel the mills, and for every two tons of sugarcane produced, one metric ton of steam is consumed. The molasses are also further refined and crystallized using steam-powered machinery.
Therefore, sugar producers, especially those in areas with considerable water stress, attempt to conserve and reuse water in every possible way.
One method to reuse water is to collect and condense steam exhaust from boilers and other industrial equipment. However, before it is reused, it is standard practice to use this condensate's high temperature to heat specific fluid streams, such as extracted cane juice or molasses, for further processing.
This process can be carried out using heat exchanger equipment while preventing the two streams from physically mixing. After, the cooled condensate usually undergoes polishing treatment before being reused as feedwater for the boiler systems or process makeup, allowing sugar manufacturers to save on water and heat.
Challenge
In actual practice, some degree of non-ideal performance within a heat exchanger is to be expected - particularly after a prolonged and repeated operation. Metal fatigue and corrosion may impact the system, causing pinholes in the metal surfaces dividing the two fluid streams and enabling leaks to occur bilaterally.
This physical breach of the barrier can cause several problems for sugar producers. If extracted juice or molasses leak into the condensate as it passes through the heat exchanger, some product will be lost. Although the losses may initially seem insignificant, over time, they can add up to an unrealized loss in revenue.
For example:
- A standard mill generates between 300,000 and 400,000 metric tons of raw sugar per year.
- As much as 0.1% of the product is wasted due to mechanical factors,1 equating to 300 to 400 tons of lost output.
- An average selling price of $400 per ton corresponds to a $120 ~ 160K USD income loss every year.
Such leaks also contaminate the condensate. In these cases, sugar producers must use additional time and resources to treat the condensate before it can be reused, assuming that doing so is economically feasible.
Otherwise, producers may be forced to dispose of the condensate, losing the opportunity to conserve water and resulting in higher treatment costs for the contaminated water before discharge.
Early leak identification is essential for reducing equipment damage and loss of product. As the data below demonstrates, current techniques for monitoring the condensate quality may fail to promptly identify organic contaminants. The negative consequences are amplified if an unaware process owner repeatedly reuses contaminated condensate.
If contaminated condensate is returned to the boiler as feedwater, the impurities in the water may be oxidized at high temperatures and form organic acids, causing the pH of the boiler to drop to dangerous levels and necessitate unplanned blowdowns.
Even if these issues are not present, organic contamination may increase the risk of solid deposition and corrosion within the boiler in the long run and reduce its operational lifespan. Expensive and time-consuming repairs or plant shutdowns may ultimately be required to return the boiler to a serviceable condition.
Solution
It is essential to adopt an analytical method that can easily recognize these contaminants since a heat exchanger leak has a high chance of introducing organic contamination into the condensate (such as molasses, extracted sugarcane juice, boiler fuel oil, etc.).
Most, if not all, organic contaminants do not ionize in water. They can even be pH neutral, so standard water quality measurements such as pH and conductivity may struggle to detect their presence.
Conversely, total organic carbon (TOC) analysis measures the concentration of all covalently linked carbon molecules in a water sample and directly indicates the condensate's organic content. TOC analysis is quantitative and quick, enabling sugar producers to make data-driven process decisions in real-time to manage condensate reuse and disposal efficiently.
A laboratory investigation was conducted to demonstrate TOC analysis sensitivity for organic contamination. Researchers began by spiking actual condensate samples with potential contaminants.
These contaminants are intermediate sugar products that receive thermal energy from hot condensate via heat exchanger equipment within an operating sugar mill. The intermediates selected for the study are “Supply juice” and “EFFET A liquor,” with spike concentrations ranging from 50 to ~500 ppm (mg/L).
The spiked condensate, which was heated to 40 ± 2 °C to simulate the typical operating condition in a sugar mill, was then recorded using a Sievers InnovOx Laboratory TOC Analyzer (Figure 1). This machine employs a unique Super Critical Water Oxidation (SCWO) technology to detect organic carbon concentrations ranging from 50 ppb (g/L) to 50,000 ppm (mg/L).
Aside from TOC, the Oxidation Reduction Potential (ORP or redox potential), conductivity, and pH of the spiked condensate samples were also measured.
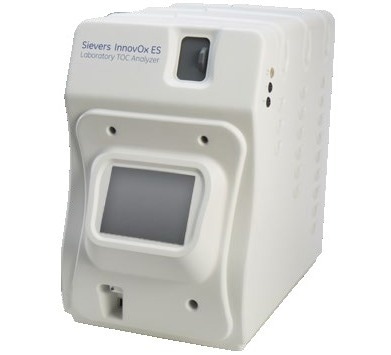
Figure 1. Sievers* InnovOx Laboratory TOC Analyzer used to measure the spiked condensate samples. Image Credit: Veolia Water Technologies & Solutions
As illustrated in Figures 2–5, the data for each parameter (TOC, redox potential, conductivity, and pH) was compared to the relevant spike concentrations of the two contaminants. Further insight into the responsiveness and sensitivity of these water quality indices may be derived by assessing the gradient and linearity of the correlation,
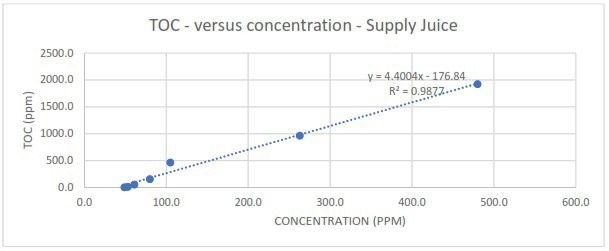
Figure 2a. Measured TOC in response to different spike concentrations of Supply juice. Image Credit: Veolia Water Technologies & Solutions
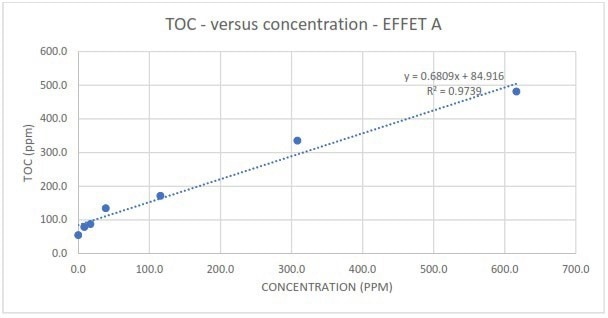
Figure 2b. Measured TOC in response to different spike concentrations of EFFET A liquor. Image Credit: Veolia Water Technologies & Solutions
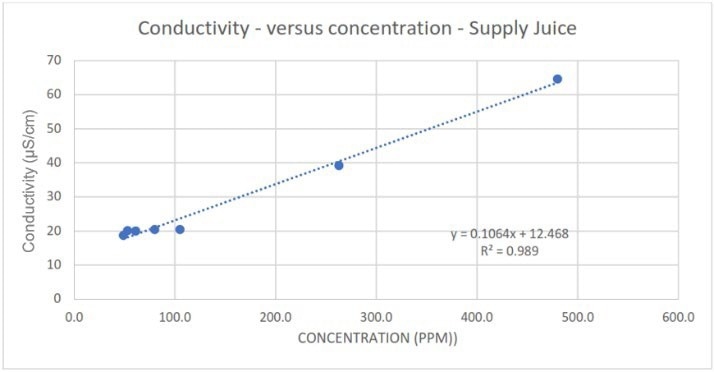
Figure 3a. Measured conductivity in response to different spike concentrations of Supply juice. Image Credit: Veolia Water Technologies & Solutions
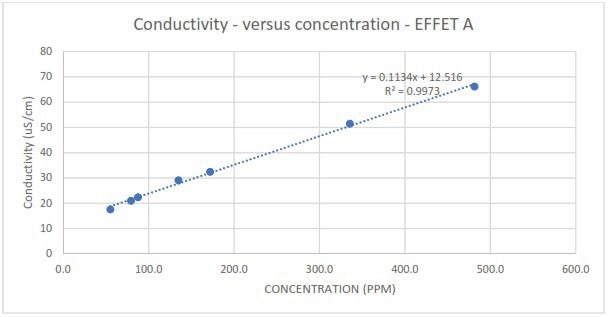
Figure 3b. Measured conductivity in response to different spike concentrations of EFFET A liquor. Image Credit: Veolia Water Technologies & Solutions

Figure 4a. Measured redox potential in response to different spike concentrations of Supply juice. Image Credit: Veolia Water Technologies & Solutions
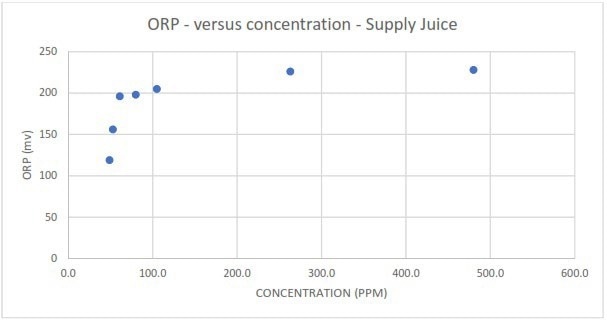
Figure 4b. Measured redox potential in response to different spike concentrations of EFFET A liquor. Image Credit: Veolia Water Technologies & Solutions
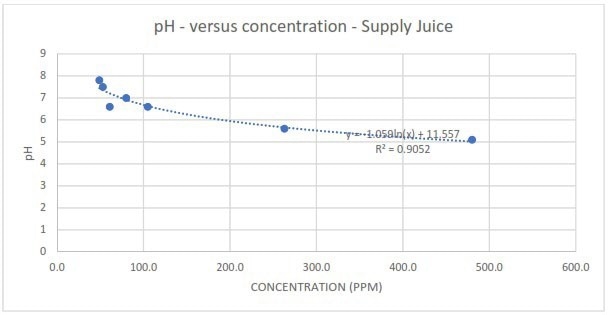
Figure 5a. Measured pH in response to different spike concentrations of Supply juice. Image Credit: Veolia Water Technologies & Solutions
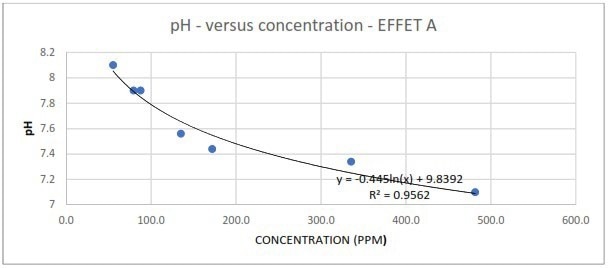
Figure 5b. Measured pH in response to different spike concentrations of EFFET A liquor. Image Credit: Veolia Water Technologies & Solutions
The research found that, regardless of contamination type, TOC readings displayed excellent linearity with varying spike concentrations. The slope of the correlations also revealed that TOC responded with extreme sensitivity across the whole spike concentration range.
Comparatively, although conductivity generally exhibited good correlations for the contaminants, considerably worse linearity was observed at lower spike concentrations of Supply juice compared to the total dataset (Figure 6).
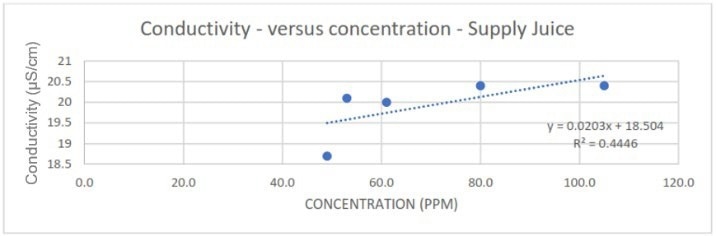
Figure 6. Poorer linearity of conductivity correlation at lower spike concentrations of Supply juice. Image Credit: Veolia Water Technologies & Solutions
The measurements also appear to lack sensitivity. The relatively low gradient of the correlations means that slight changes in conductivity readings may be mistaken for process noise or attributed to measurement uncertainty inherent to the conductivity sensor/probe.
Contrary to TOC and conductivity, establishing linear relationships for redox potential was relatively unsuccessful. Redox measurements in the condensate spiked with Supply juice displayed marginal linearity at spike concentrations under 100 ppm but plateaued after this threshold.
Despite higher contaminant concentrations, Redox measurements became unreadable when challenged with the EFFET A liquor contaminant, suggesting the lack of a cause-and-effect relationship.
There was also no linear correlation between the pH of the condensate and the contaminant's spike concentration. The measurements could only be fitted to a logarithmic function, illustrating the lack of practicality and sensitivity of depending on pH readings to identify the presence of organic contamination in the condensate.
Conclusion
It is essential for sugar producers to monitor condensate quality, especially across heat exchanger equipment, to prevent product and income loss. It is also crucial to guarantee the purity of condensate intended for reuse to protect vital equipment from the threat of contaminated condensate.
Conductivity, redox potential, and pH are frequently used as water quality measures. While these metrics may excel at detecting ionic contaminants, they have significant limitations when addressing organic contamination, especially when the contaminant is present at low concentrations.
For condensate quality monitoring, relying solely on these indices can reduce process visibility and, as a result, lead to flawed judgments that could result in higher production costs or equipment damage.
TOC analysis provides an accurate, quick, and sensitive means to identify the presence of organic contamination and is an essential tool for ensuring condensate quality. Employing online TOC monitoring at crucial steps in the process helps sugar mills to detect leaks that could result in costly production losses and damaged equipment.
References
- Quantification of Sugar Content Loss in various Byproducts of the Sugar Industry, International Journal of Advance Industrial Engineering, Vol. 3, No. 2 (June 2015)

This information has been sourced, reviewed, and adapted from materials provided by Veolia Water Technologies & Solutions.
For more information on this source, please visit Veolia Water Technologies & Solutions, Sievers Instruments.