Mineral oil hydrocarbons (MOH) are extensively utilized as lubricants and may contain mutagenic and carcinogenic impurities. Therefore, food safety authorities mandate testing ingredients, finished products, and packaging materials.
The complete analysis of MOH uses a combined liquid and gas chromatography method, which is very difficult and time-consuming.
This article establishes the potential of automated headspace-SIFT-MS analysis to screen larger numbers of packaging samples – exceeding 220 per day – for the volatile MOH fraction. This method offers a quick indication of contamination in packaging materials.
SIFT-MS can also quantify benzene contamination simultaneously – addressing this recently acknowledged need for personal care products (PCPs).
Introduction
Polymers are created by polymerizing low molecular weight organic compounds, potentially trapping monomer residues and other volatile by-products within the polymeric material.
Recycled polymers may harbor additional volatile impurities that either migrate into the material during prior use or are produced through the recycling process.
Identifying and quantifying volatile impurities are critical for manufacturers planning to use recycled polymeric materials in packaging materials, whether for pharmaceutical products, foods, or personal care products (PCPs). This is because these impurities can migrate through the polymer into the product.
For food contact materials (FCMs), the “MOSH and MOAH” analysis (mineral oil saturated hydrocarbons and mineral oil aromatic hydrocarbons, respectively) is widely employed for mineral oil hydrocarbon (MOH) content. This analysis is vital because packaging is suspected to be a significant source of these impurities.3
MOH constitutes a complex mixture of hydrocarbons and tends to elute from standard chromatographic analyses as a broad band rather than individually resolved components.2,3 Therefore, the test reports total MOSH and MOAH content, covering hydrocarbons in the C10 to C50 range.
Highly sophisticated automated sample preparation and analysis solutions, incorporating liquid and gas chromatography steps, have been established with a throughput of up to two samples per hour (Figure 1).
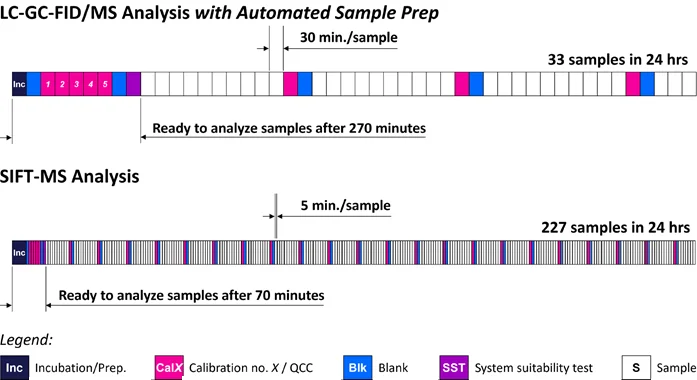
Figure 1. Headspace SIFT-MS enables high-throughput screening of polymers for benzene and volatile MOSH and MOAH, providing enhanced quality control. Image Credit: Syft Technologies
This article introduces the application of selected ion flow tube mass spectrometry (SIFT-MS), a direct-injection MS method, for pre-screening polymer packaging materials for volatile MOSH and MOAH. SIFT-MS has demonstrated the ability to analyze headspace samples at a throughput of 12 samples per hour (Figure 1).4
Headspace-SIFT-MS can also effectively analyze benzene with high sensitivity as part of the same analysis, addressing one aspect of the developing need to decrease benzene content in PCPs.1
This study showcases the automated SIFT-MS screening of high-density polyethylene (HDPE) and polypropylene (PP) systems.
Methods
1. Automated SIFT-MS Analysis
The SIFT-MS method is detailed in another source.6 In essence, it uses rapidly switchable reagent ions (H3O+, NO+, and O2+) for gas-phase soft chemical ionization of trace volatile organic compounds (VOCs) in air and headspace.
The chromatography-free SIFT-MS enables real-time, high-throughput analysis. Selectivity is realized by combining several ionization mechanisms and mass spectrometric detection.
This study used a commercial SIFT-MS instrument (Voice200ultra, Syft Technologies, Christchurch, New Zealand). Automated headspace-SIFT-MS analysis was accomplished using a multipurpose autosampler (MPS Robotic Pro, GERSTEL, Mülheim, Germany).4
Headspace was sampled with a 2.5-mL headspace syringe (heated to 150 °C), which was then injected into the autosampler inlet of the SIFT-MS instrument (heated to 150 °C) at a flow rate of 50 μL s-1 through a self-sealing GERSTEL septum-less sampling head.
Given the nominal sample flow into the SIFT-MS instrument at 420 µL s-1, a make-up gas flow (consisting of ultra-high purity nitrogen) is also introduced through the sampling head. Comprehensive full-scan data were gathered in this study for each sample in a single analysis within 40 seconds, utilizing all three positively charged reagent ions.
Headspace concentrations for compounds with carbon numbers up to C16 were calculated from this data for MOSH and MOAH components using a recently defined technique.5
In short, the benzene alkyl derivatives were targeted as representative of the MOAH class. The nomenclature used here for aromatic species corresponds to the number of carbons in the side chains.
Table 1. HDPE sample identities, descriptions, and relative intensities of (i) volatile emissions observed in the SIFT-MS SCAN spectra and (ii) volatile MOSH/MOAH emissions. Emissions within 5% of each other are ranked equally. Source: Syft Technologies
| Sample ID |
Description |
Relative total volatile emissions (1-highest) |
Relative MOSH/MOAH emissions (1-highest) |
| H-V1 |
Virgin, craft |
13 |
14 |
| H-V2 |
Virgin, craft |
12 |
13 |
| H-V3 |
Virgin, craft |
11 |
9 |
| H-V4 |
Virgin, scientific |
10 |
6 |
| H-R1 |
Recyclate (manuf. 1) |
9 |
9 |
| H-R2 |
Recyclate (manuf. 2) |
3 |
4 |
| H-R3 |
Recyclate (manuf. 2) |
7 |
7 |
| H-R4 |
Recyclate (manuf. 3) |
6 |
4 |
| H-R5 |
Recyclate (manuf. 3) |
3 |
2 |
| H-R6 |
Recyclate (manuf. 4) |
13 |
12 |
| H-R7 |
Recyclate (manuf. 5) |
1 |
3 |
| H-R8 |
Recyclate (manuf. 5) |
1 |
1 |
| H-R9 |
Recyclate (manuf. 6) |
5 |
7 |
| H-R10 |
Recyclate (manuf. 6) |
8 |
11 |
Table 2. PP sample identities, descriptions, and relative intensities of (i) volatile emissions observed in the SIFT-MS SCAN spectra and (ii) volatile MOSH/MOAH emissions. Emissions within 5% of each other are ranked equally. Source: Syft Technologies
| Sample ID |
Description |
Relative total volatile emissions (1-highest) |
Relative MOSH/MOAH emissions (1-highest) |
| P-V1 |
Virgin, scientific |
2 |
2 |
| P-V2 |
Virgin, craft |
6 |
3 |
| P-V3 |
Virgin, reclaimed |
7 |
6 |
| P-R1 |
Recyclate (manuf.7) |
3 |
3 |
| P-R2 |
Recyclate (manuf. 7) |
4 |
5 |
| P-R3 |
Recyclate (manuf. 7) |
4 |
6 |
| P-R4 |
Recyclate (manuf. 7) |
1 |
1 |
For instance, the combined concentration of ethylbenzene and the xylene isomers is denoted as “C2-alkylbenzenes”. The MOSH class was targeted through alkanes comprising 10 to 16 carbon atoms (C10 – C16).
Each measurement signifies the total of alkanes with a specific carbon number (for example, “C10-alkanes” includes n-decane and all its branched isomers).
2. Samples
Tables 1 and 2 provide a summary of the HDPE and PP samples, respectively, utilized in this study.
A diverse range of virgin and recycled products were analyzed (1 g in 20-mL sample vial; ten replicates per sample) in randomized order and with interspersed blanks introduced every 10 samples for the two data collection events (one for each polymer type). Samples underwent a 20-minute incubation at 80 °C.
Results and Discussion
Figure 2 provides a summary of the results attained from reprocessing SIFT-MS full-scan data for the 14 HDPE and seven PP samples. The MOSH and MOAH components fall within the original acquisition range, up to 250 m/z.
The contributions of benzene and the other sub-MOAH aromatics are depicted separately for each polymer type.
Related Stories
Regarding alkanes, the contributions of C2n and C3n for HDPE and PP, respectively, are summarized separately (shown in purple in Figure 2) from the other carbon chain lengths (shown in pink) to differentiate between the alkane contributions originating from monomer building blocks (ethylene and propylene) and alkanes from other sources.
The determination of volatile MOSH and MOAH concentrations is straightforward with SIFT-MS. While recycled HDPE samples typically exhibit the highest MOSH and MOAH concentrations, a PP sample (P-R4) stands out as the worst overall (representing a “worst-case” post-consumer recyclate, whereas P-R3 is considered a “best-case”).
Tables 1 and 2 rank the total volatile MOSH and MOAH emissions for HDPE and PP, respectively. These rankings differ from the total volatile emissions because of the presence of non-MOSH/MOAH volatile residues.
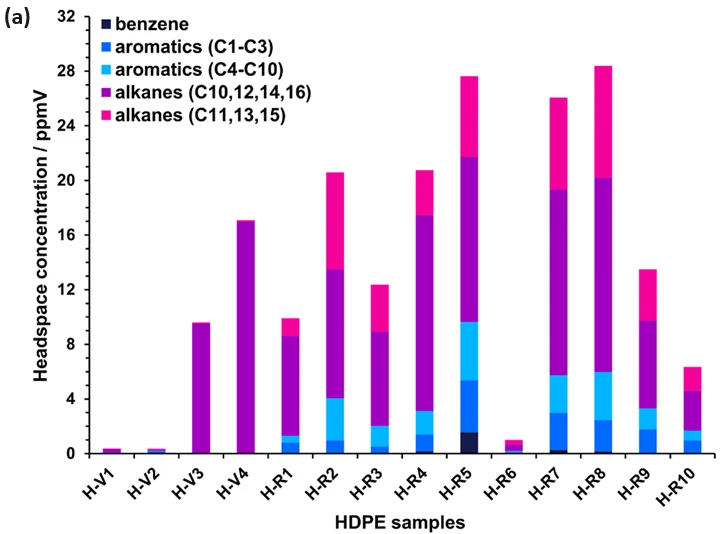
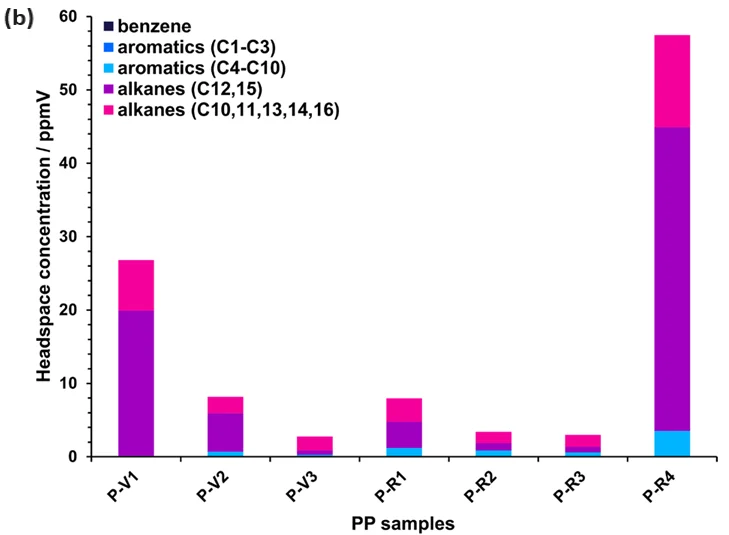
Figure 2. Headspace concentrations of various components measured using automated SIFT-MS in (a) HDPE (Table 1) and (b) PP samples (Table 2). See the text for more details. Image Credit: Syft Technologies
The C2n alkanes for HDPE dominate the volatile MOSH and MOAH emissions from virgin polymer samples (Figure 2(a)). However, these emissions exhibit different abundances, with the scientific product interestingly displaying the highest emissions (sample H-V4).
In contrast, recycled HDPE samples demonstrate different MOSH/MOAH profiles. Notably, there is a substantial non-C2n presence, suggesting that these may originate from degradation during the cleaning and extrusion process or residual contamination from prior use, based on the limited sample set studied (Table 1).
Aromatic hydrocarbons are also present at significant levels in recycled HDPE. Unless these residues originate from the degradation of additives during recycling, they appear to arise from prior use.
The aromatics cover a broad range of carbon numbers, as common solvents (C2- to C3-alkylbenzenes in mineral turpentine) and higher aromatics (C4- to C10-alkylbenzenes; low molecular mass MOAH) both occur at noteworthy concentrations.
For PP (Figure 2(b)), the difference between virgin and recycled products is less clear – at least for this restricted sample set.
Besides C3n alkane residues, virgin and recycled PP exhibit substantial concentrations of alkanes that are not multiples of the monomer unit (such as C10 and C11). This seems to result from polymer synthesis, hence the alkanes do not help in the verification of virgin product.
Volatile MOAH residues (C4- to C10- alkylbenzenes) are present in all recycled products, as well as in one virgin product (craft; P-V2). Therefore, the volatile MOAH analysis may prove useful for authenticating high-grade virgin PP versus low-grade virgin and recycled products.
There have been recent concerns about the detection of benzene in different PCPs because of its harmful health effects.1
In these polymer samples, while benzene content is observable in Figure 2 only for samples H-R5 and H-R7, it occurs at trace levels in many samples (Figure 3). Only virgin HDPE and one recycled HDPE (H-R6) are essentially free of benzene.
The levels in numerous recycled HDPE samples are high. Although all PP samples have benzene residue, concentrations are at the lower end of the recycled HDPE samples.
The findings observed in the recycled HDPE samples are concerning, especially because these samples were being considered for use in consumer product packaging. It is evident from this data that recycled HDPE (in particular) and recycled PP should undergo screening for benzene content before re-use.
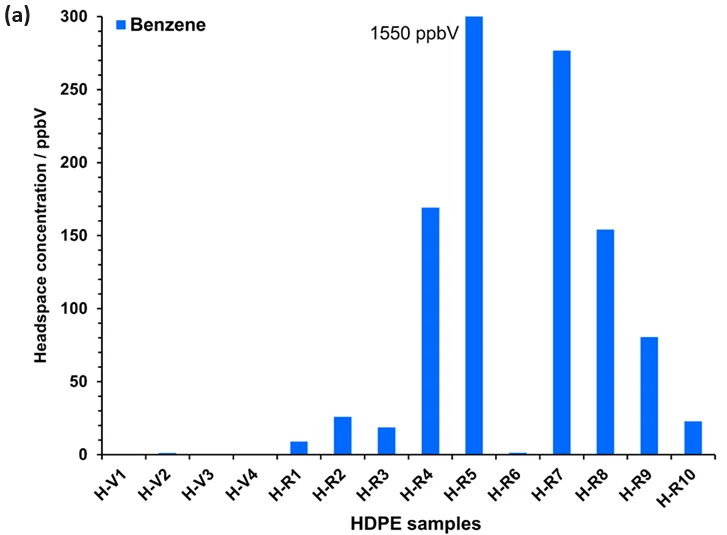
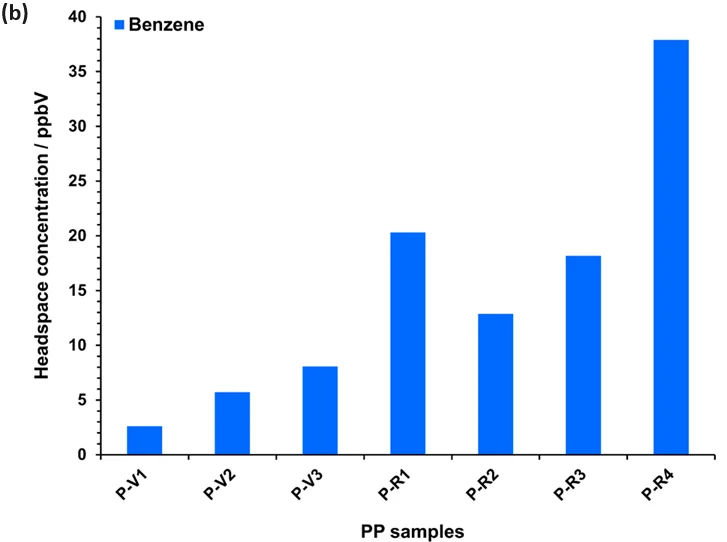
Figure 3. Headspace concentrations of benzene measured using automated SIFT-MS in (a) HDPE (Table 1) and (b) PP samples (Table 2). See the text for more details. Image Credit: Syft Technologies
Conclusions
- Simple and highly sensitive SIFT-MS analysis effectively detects volatile MOSH and MOAH compounds, including benzene.
- Benzene poses a substantial contamination risk in HDPE recycling, with a general increase in volatile MOAH content.
- High-throughput automated analysis capability, exceeding 220 samples per day, offers enhanced screening for volatile residues.
- Low cost per sample can be achieved because of straightforward sample preparation (no extraction, preconcentration, etc.) and instrument operation.
- Well-suited for quality assurance and quality control applications.
- Potential for online monitoring during processing.
- Supports sustainability initiatives.
References and Further Reading
- Bettenhausen CA (2022). Finding benzene everywhere we look. Chem. & Eng. News. 100(1), 24-26.
- Bratinova S, Hoekstra E (Editors) (2019). Guidance on sampling, analysis and data reporting for the monitoring of mineral oil hydrocarbons in food and food contact materials. Luxembourg: Publications Office of the European Union, ISBN 978-92-76- 00172-0, JRC115694. DOI:10.2760/208879.
- EFSA (EFSA Panel on Contaminants in the Food Chain (CONTAM)) (2012). Scientific Opinion on Mineral Oil Hydrocarbons in Food. EFSA Journal 10, 2704 [185 pp.]. DOI: 10.2903/j.efsa.2012.2704.
- Perkins MJ, Langford VS (2021). Application of routine analysis procedures to a direct mass spectrometry technique: selected ion flow tube mass spectrometry (SIFT-MS). Rev Sep Sci. 3, e21003. DOI: 10.17145/rss.21.003.
- Langford VS, Perkins MJ (2022). Simple, Rapid Analysis of Packaging for volatile MOSH and MOAH Contaminants. Syft Technologies application note. Available online: http://bit.ly/3iEIGD1
- Smith D, Španěl P, Demarais N, Langford VS, McEwan MJ (2023). Recent developments and applications of selected ion flow tube mass spectrometry (SIFT-MS). Mass Spec. Rev. e21835. DOI: 10.1002/mas.21835.

This information has been sourced, reviewed and adapted from materials provided by Syft Technologies.
For more information on this source, please visit Syft Technologies.