Jul 14 2014
Los Gatos Research (LGR), a member of the ABB Group, today announced the successful application of its laser-based Fast Greenhouse Gas Analyzer for mobile monitoring of methane leakage from oil exploration and distribution pipelines.
The analyzer is a key contributor to an automobile-based system that makes possible real-time, high-fidelity mobile measurements of greenhouse gases and pollutants. Such measurements can improve safety, increase climate-related knowledge, and minimize product loss.
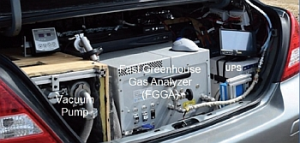
The LGR trace gas analyzer works in conjunction with a global positioning system, sonic anemometer, and real-time graphical display for visualizing acquired data mounted within or on the car. A fast-flow vacuum pump pulls samples through the analyzer in less than 0.2 seconds to enable high spatial resolution while driving at highway speeds.
LGR expects these systems to supplant or supplement fixed measurement stations and laboratory analysis of flask samples. The mobile measurements enable quantification of time-related variables such as shifting winds, pulsed emissions, or multiple shifting emission sites.
As detailed in the July/August 2014 issue of Gases & Instrumentation, installing suitable LGR analyzers in a mobile platform, such as a car, boat, or aircraft, greatly facilitates pinpointing methane emissions and sources. Key to these measurements is LGR’s patented technology called Off-Axis Integrated Cavity Output Spectroscopy (OA-ICOS). LGR instruments offer the necessary analysis speed, precision and sensitivity. And, unlike alternative technologies, LGR instruments do not need consumable gases, are insensitive to vibration, and have low maintenance requirements.
The mobile system uses additional OA-ICOS analyzers from LGR to measure secondary trace gases such as ammonia (NH3) and nitrogen dioxide (NO2). These analyzers help to discriminate between methane sources, such as emissions from landfills, dairies, diesel trucks, and other heavy machinery.
The simultaneous measurements of multiple gas concentrations, GPS coordinates, and wind velocity combine with instantaneous Internet download of satellite imagery from Google Earth. The result is real-time mapping of the measured results as indicated in the figure above. This figure shows discovery of a pipeline leak in an orchard while driving at highway speeds of about 55 mph. The color bars at top indicate the levels of methane and ammonia.