However, the intrinsic benefit of layer-by-layer material addition—increased design freedom—brings with it a number of difficulties linked to local solidification and the potential creation of various flaws. Finite element simulations are typically used for the quantification of isotherms or the research of the fundamental solidification variables due to the difficulty of conducting and analyzing temperature measurements in a spatial and temporal resolution.
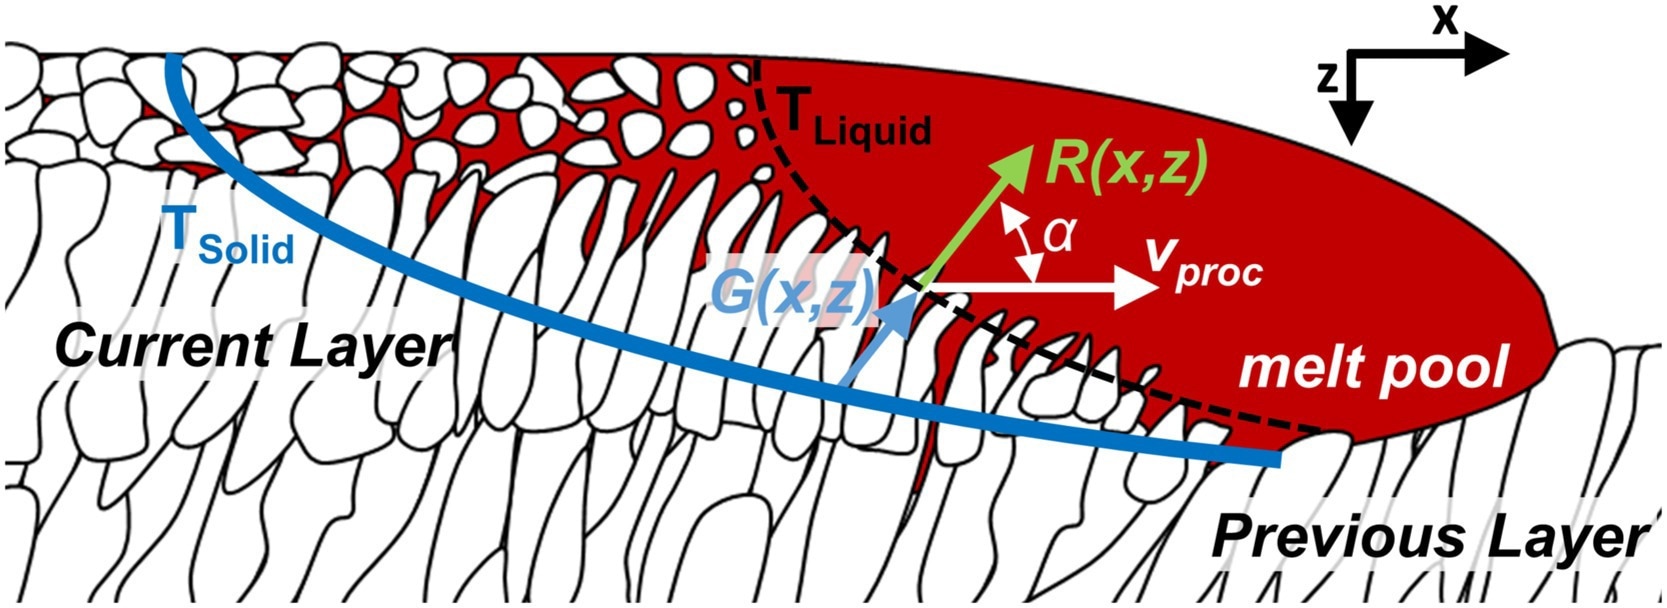
Schematic sketch of local solidification front during L-DED manufacturing. The direction of the movement of the laser beam is from left to right (green arrow). Liquid material is represented by the red color, while solid material is shown in white. The melt solidifies between liquidus isotherm (dashed black line) and solidus isotherm (blue line). Image Credit: Hagenlocher, C et al., Additive Manufacturing Letters
Infrared imaging has been shown in several recent investigations to be able to meet the criterion for a time and spatially resolved assessment. The majority of the work described, however, is restricted to the examination of the temporal evolution of just a few specific spatial places within the temperature field that was collected.
The majority of published studies are only concerned with the temperature field on the melt pool's top surface and the current layer. The top surface of each layer is remelted by the adjacent layer in the case of thin wall construction. As a result, the microstructure that is still present in the deposited section is specifically interested in the form and solidification factors along the entire layer height, particularly at the bottom side of the melt pool.
About the Study
In this study, the authors used infrared imaging to analyze the successive addition of separate layers in both spatial and temporal resolution, which resulted in cumulative heat input and caused a constant temperature shift as the build progressed in order to access thorough research of this effect. The current work described a technique for monitoring the L-DED process zone that used image-based analysis. The algorithm identified the current locations of the melt pool and the solidification zone the instant that the process zone entered the infrared camera's field of vision. When L-DED was manufactured using various process settings, the collected isotherms showed how the temperature field changed.
The team discussed the geometry and location of the acquired isotherms to infer the local solidification rates and temperature gradients. The comparison of different solidification conditions' geographic distributions showed how significantly the process parameters affected L-DED solidification. During the L-DED processing of thin walls, a method was devised for the experimental determination of the fundamental solidification variables throughout the total layer height in temporal and spatial precision.
The researchers explained an image processing algorithm after the description of the experimental setup and process for obtaining temperature fields with an infrared camera. In addition to the extraction of the current geometry of the liquidus and solidus isotherm, and calculation of the instantaneous position of the process zone in each layer, the technique also inferred the local solidification rates and temperature gradients. By the construction of rectangular aluminum columns with varied processing parameters, the new technique was tested.
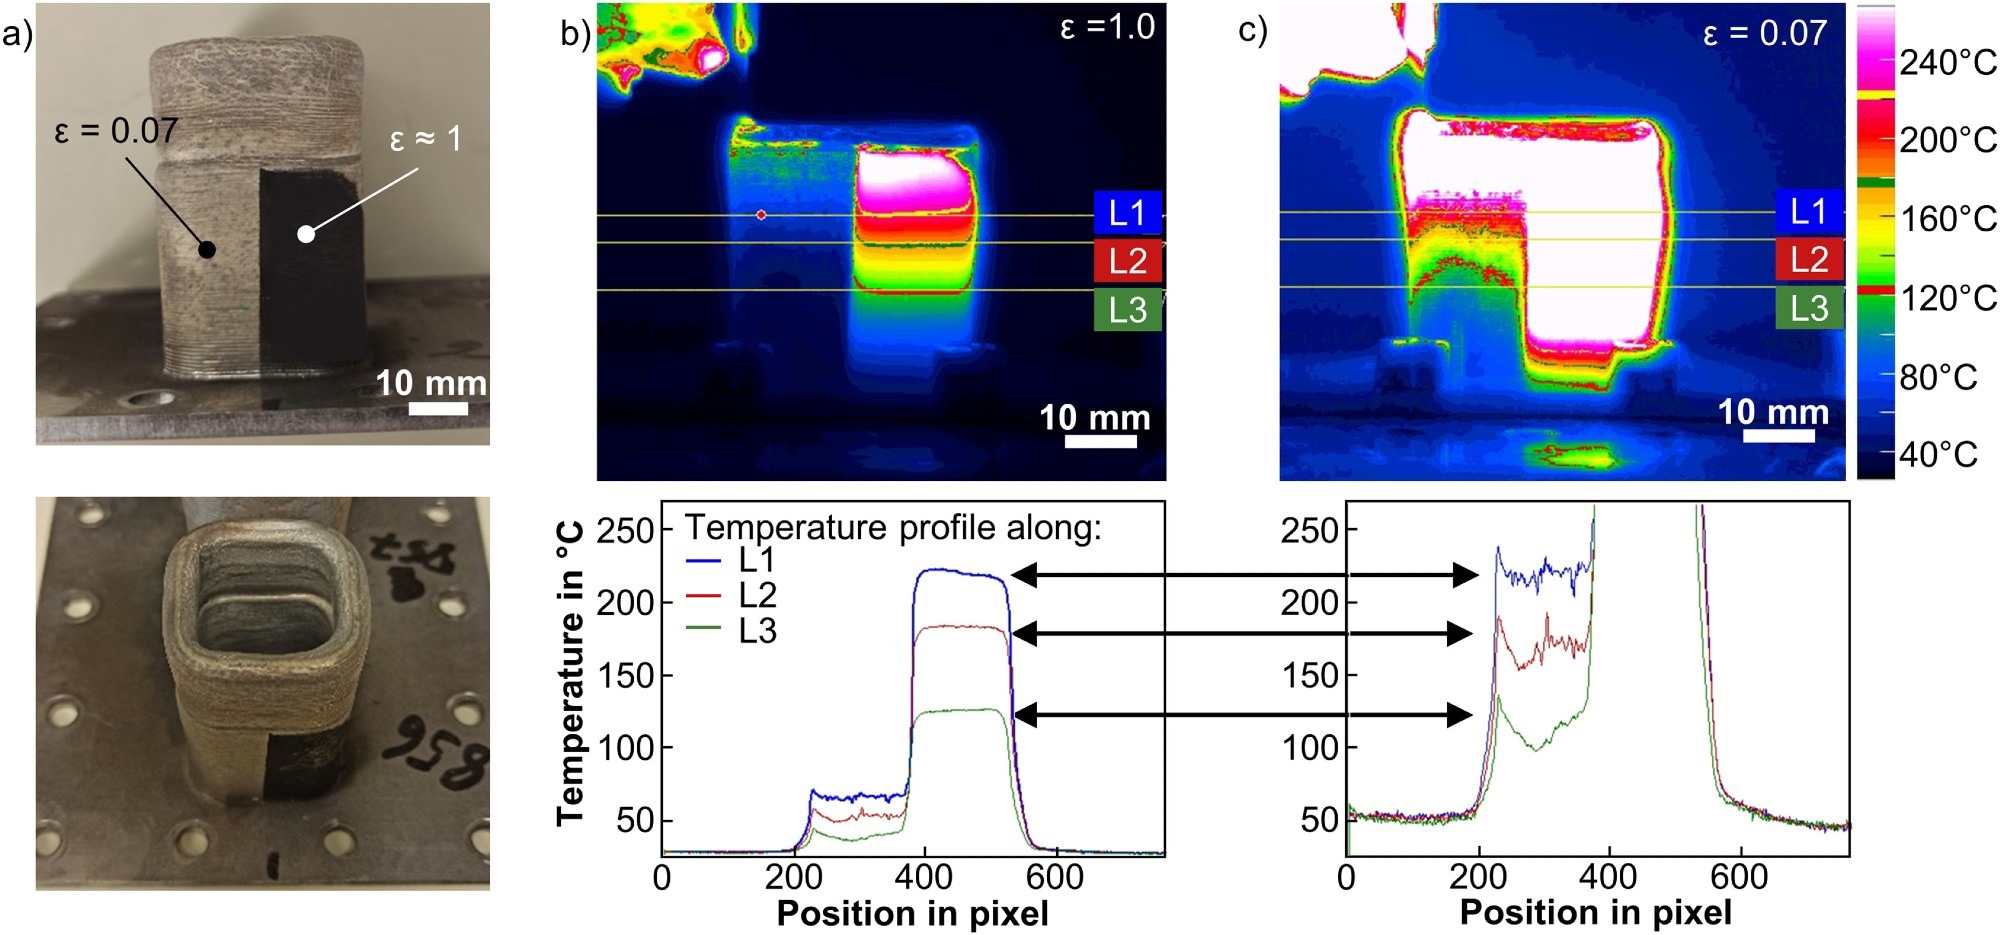
Calibration of the infrared images: a) Pictures of a calibration sample partly coated with graphite, b) captured temperature distribution (top row) and temperature profiles along three horizontal lines (bottom row) in case of assumed emissivity of ε ≈ 1, and c) captured temperature distribution (top row) and temperature profiles along three horizontal lines (bottom row) in case of emissivity of ε ≈ 0.07. Image Credit: Hagenlocher, C et al., Additive Manufacturing Letters
Observations
In the case of L-DED manufacturing with a process velocity of 4.5 m/min, the bottom of the melt pool had a maximum temperature gradient of roughly 700 K/mm. In the instance of L-DED production at a process velocity of 1.5 m/min, this maximum value dropped when process velocity was decreased to an average value of roughly 300 K/mm. The same was true for the solidification rate, which reached its maximum value towards the end of the melt pool and was equal to the highest process velocity, determined to be 4.5 m/min. It was demonstrated that an increase in process velocity caused melt pools to become longer and shallower, which was consistent with welding procedures used in the past.
The temperature gradient was calculated from the temperature field at the corresponding places of the liquidus isotherms, and the local solidification rates were calculated from the isotherms' geometries. The results indicated that in the event of high process velocities, the largest temperature gradients and solidification rates occur.
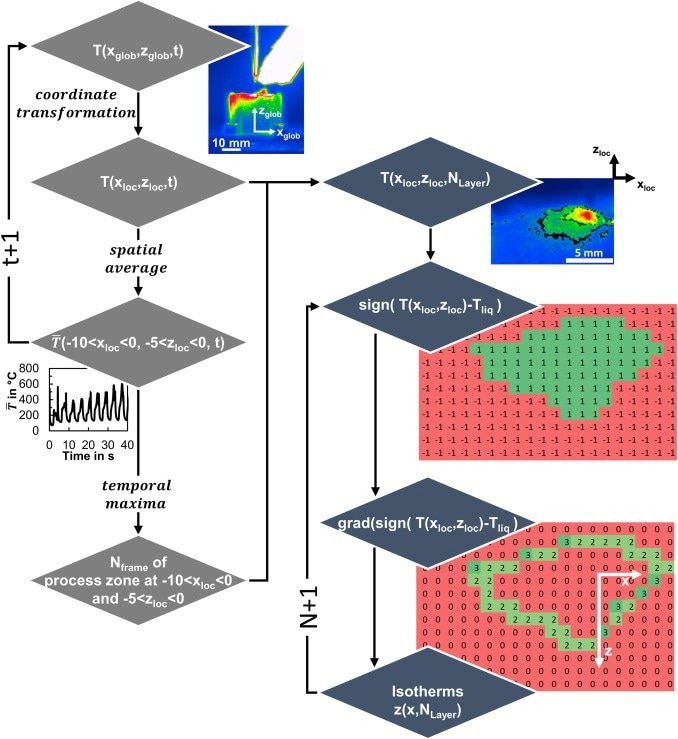
Flow chart of the basic steps of the image processing algorithm. The light grey rhombuses represent the steps to determine the points in time when the process zone is present in the ROI at -10 mm < xloc < 0 and -5 < zloc < 0. The dark grey rhombuses describe the steps for the extraction of the isotherms in the processing zone. Image Credit: Hagenlocher, C et al., Additive Manufacturing Letters
Conclusions
In conclusion, this study described a method that uses image processing of infrared videos to investigate the conditions of local solidification during L-DED production in both temporal and spatial resolution. Local temporal maxima of a moving ROI's average temperature were used to successfully pinpoint the location of the mobile processing zone and the ROI's geometry to correctly identify the liquidus- and solidus isotherms.
The authors mentioned that the evaluation of the solidification conditions algorithm is expected to improve DED process optimization and aid in the development of microstructure creation techniques. They stated that future research will concentrate on how process parameters affect solidification variables, including how they vary over time as a building's height increases.
Disclaimer: The views expressed here are those of the author expressed in their private capacity and do not necessarily represent the views of AZoM.com Limited T/A AZoNetwork the owner and operator of this website. This disclaimer forms part of the Terms and conditions of use of this website.
Source:
Hagenlocher, C., Toole, P. O., Xu, W., et al. In process monitoring of the thermal profile during solidification in laser directed energy deposition of aluminium. Additive Manufacturing Letters 100084 (2022). https://www.sciencedirect.com/science/article/pii/S2772369022000536