Some particle size instruments, known as single particle counters, measure individual particle size, while others measure surface area as a function of particle size. Further instruments measure mass or volume versus size, while others still measure multiple functions of scattered light intensity as a function of size.
Each of these instruments can generate particle size distributions and, in theory, one can transform between types in order to correlate the results. In practice, if a measurement with a single particle counter generated a differential number-weighted size distribution, how would one undertake a comparison of the results with a measurement deriving from a different type of instrument, which generated a differential volume-weighted size distribution?
Transform One Weighting to Another
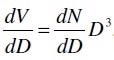
Converting the differential number-weighted distribution to a differential volume-weighted distribution, or vice versa, is one way of easily doing this. For every size class in the discrete Number Fraction/(Size Class) distribution* , the number, or count, must be multiplied by the diameter cubed (spheres are presumed). In the example of discrete distributions, the diameter to be cubed is most probably the midpoint of the size class.
The outcome is a discrete Volume Fraction/(Size Class) distribution. Converting a continuous differential number-weighted distribution into a continuous differential volume-weighted distribution, necessitates multiplication by D3. The outcome is a continuous volume-weighted differential distribution. The consequent un-normalized numerical values are easily remedied. A straightforward example utilizing continuous distributions is exhibited here:
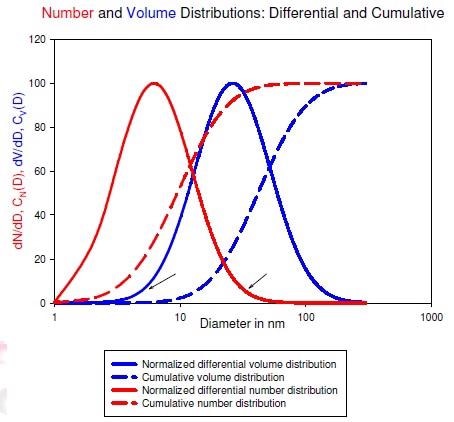
The bell-shaped curves represent the differential distributions weighted by number, dN/dD, or by volume, dV/dD. The sigmoidal curves represent the cumulative distributions weighted by number, CN(D), or by volume, CV(D). It is likely that the initial measurement calculated dV/dD, from which, by integration, CV(D) was established.
Subsequently, to establish the un-normalized dN/dD, the following formula is required:
It is then necessary to divide by D3 at each y-value of the differential volume-weighted distribution, thus producing a set of un-normalized numbers, from which the maximum number must be determined, along with the factor that will convert that value into 100. This factor should subsequently be applied to all the other un-normalized values, thus normalizing the differential number distribution.
Relationship Among Transformed Distributions
It is notable that dV/dD is always shifted further to the right, towards larger Ds, than dN/dD. Similarly, the cumulative distributions are shifted in a comparable fashion. The volume distribution’s modal diameter, which corresponds to the peak in the differential distribution, and median diameter, which equates to the diameter at 50% of the cumulative distribution, are always greater than the corresponding diameters among the number distribution.
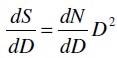
If these represented nonporous particles**, then the surface area-weighted differential distribution, dS/dD, would correspond to the number-weighted using the following simple equation:
Moreover, the curves, once they had been normalized and plotted, would rest between the number- and volume-weighted for both the differential and cumulative representations.
First Warning: Which Weighting Was It?
If the median diameter is determined to be 10.0 nm, and it describes a broad distribution, omitting to examine weighting will deprive the researcher of a substantial amount of information. In the graph above, although the number median diameter is 10.0 nm and it describes a broad distribution, the volume median diameter is 42.3 nm and a significant proportion of the particles are well above 10.0 nm in volume.
Second Warning: Transformations Can be Dangerous
A further examination of the graph reveals two arrows, one at the base of each differential distribution. A large proportion of the dN/dD distribution is caused by a relatively small volume of particles in the left-hand tail of dV/dD, while a large proportion of the dV/dD distribution is caused by a relatively small number of large particles in the right-hand tail of dN/dD is responsible for a. This scenario can have disastrous consequences.
It can be assumed that all the particles were utilized during the calculation of the results, but this is not always the case. Indeed, knowledge of the data in the tails of the differential distribution often remains imprecise. In a typical counting experiment, the researcher will tend to under-count a relatively low number of large particles. However, these are the exact particles that dominate the volume distribution. Consequently, the calculated volume distribution is shifted far too low.
Moreover, in a typical experiment using diffracted or scattered light, the small particles make a relatively low contribution to the signal, and consequently they are under-represented in the distribution with the most natural weighting (intensity-weighted in this instance). As a result, the calculated number distribution is typically shifted far too high. For these reasons, transformations might be particularly inaccurate, even though they are simple algebraically.
Another Example Using a Bimodal Distribution
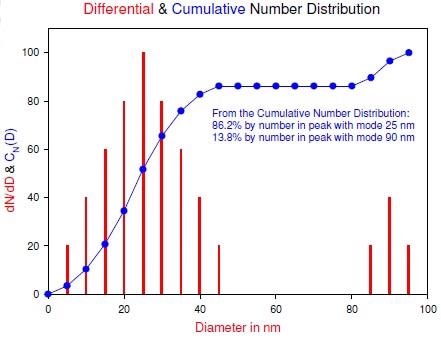
The peak centered on 90 nm represents a far smaller relative quantity of particles than the peak centered on 25 nm, and it is also narrower. Following the transformation to surface area-weighted, it is unsurprising that the amount by surface area has shifted to the larger sizes: 35.8% by surface area centered on 35 nm mode and 64.2% by surface area centered on 90 nm mode.
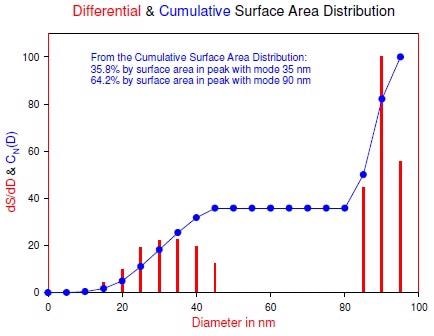
It is similarly unsurprising that the 90 nm peak remains the mode, given its narrowness. Whereas the lower peak is somewhat broad and similar to the example of the broad unimodal distribution scrutinized earlier, the entire peak shifts to the right. Finally, the volume-weighted distribution continues the trend:
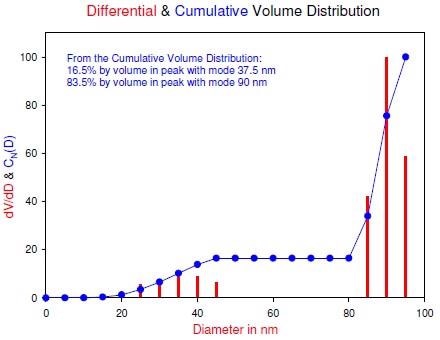
The larger peak centered on 90 nm contains, by amount, most of the volume, whereas, it contains the least by number. The cumulative distributions embody a noticeable plateau. This typifies multimodal distributions. It is possible to read off the amount in each peak by locating the plateau value, either from the graph or from a corresponding tabular presentation.
Which Weighting Should be used to Best Present the Data?
Sometimes the weighting is directed by the choice of field: measurements of blood, sperm, or micro-contaminates necessitate the absolute number per unit volume. The use of a single particle counter to stay with the number distribution is advised. If the particles are utilized by mass, implement the volume distribution (it is assumed that all the particles will embody identical density; if this is not the case, the mass and volume distributions are no longer equal).
Summary
While it is important to know whether the “size” represents a true spherical radius or diameter, or an equivalent spherical size determined by the measurement method, it is just as important to know whether the distribution is weighted by surface area, number, volume-mass, or intensity. Without this data, any interpretation of the results is limited.
It is important to emphasize that, although the algebra to transform one distribution to another is relatively straightforward, assuming that every particle has been measured leads to some common mistakes. These comprise: the omission, while counting particles, of an important but relatively low proportion of large particles that embody the majority of the distribution’s volume and mass; and the omission of an important but relatively high proportion of small particles that embody the majority of the number weighted data, as a result of their low contribution to the intensity of scattered light.
References and Further Reading
*For a definition of Fraction/(Size Class), see the application note “What Is A Discrete Particle Size Distribution?”.
**Porous particles that embody a lot more surface area. Surface area-weighted size distributions should not be quantified from either number- or volume-weighted distributions, unless it is confirmed that the porosity is not important. This is true for liquid droplet particles but not true for many oxide particles.

This information has been sourced, reviewed and adapted from materials provided by Brookhaven Instrument Corporation.
For more information on this source, please visit Brookhaven Instrument Corporation.