The calendering and coating processes may result in visibly detectable mechanical defects in the electrodes. The coating effect can cause bubbles/pinholes, agglomerations, contaminants, or fissures. To generate high-quality electrodes, these defects like bubbles, scratches, and agglomerates must be reduced or eliminated. In the present study, YOLOv5 was used as the deep learning model to detect defects and draw bounding boxes surrounding them, as well as the labels and prediction probability. A successful application of this technology might likely pave the way for the development of a near real-time feedback loop for determining optimal coating parameters for electrodes without defects.
![Schematic view of the steps in electrode production.[30] The first step in electrode manufacturing is slurry mixing where the raw active material is mixed with binder, solvent, and other additives. Coating and drying is the process of dispersing the slurry onto the aluminum (cathode) and copper (anode) metal foils and drying the coated material to evaporate the solvents. In the calendering step, the coated material is pressed onto the metal foil to provide the consistent thickness, porosity, and adhesion. Notching cuts the calendared electrodes into the right shape. Notching is the step in which individual electrode sheets are cut out of the electrode coil.](https://www.azom.com/images/news/ImageForNews_60251_16660007971466313.png)
Schematic view of the steps in electrode production.[30] The first step in electrode manufacturing is slurry mixing where the raw active material is mixed with binder, solvent, and other additives. Coating and drying is the process of dispersing the slurry onto the aluminum (cathode) and copper (anode) metal foils and drying the coated material to evaporate the solvents. In the calendering step, the coated material is pressed onto the metal foil to provide the consistent thickness, porosity, and adhesion. Notching cuts the calendared electrodes into the right shape. Notching is the step in which individual electrode sheets are cut out of the electrode coil. Image Credit: Choudhary, N., et al., Advanced Intelligent Systems
About the Study
In this study, the team conducted the defect detection process in three steps. The process began with data collection that included capturing electrode images consisting of bubbles, agglomerates, scratches, and foils. This was followed by image annotation and then by the utilization of a custom dataset for model training. The experimental data was generated at RWTH Aachen University’s eLab.
The coating trials were carried out at coating speeds of 1.0 m min-1 at a 100 °C convection drying temperature for chamber 1 and 80 °C for chamber 2. A Cognex camera positioned in the coating machine was used to collect 882 optical photographs of the electrodes. The LabelMe tool was used to draw the bounding boxes surrounding the defects as well as to provide labels to the classes, which were then utilized in training the YOLOv5 model. About 80% of the data was used in training the model and the remaining 20% of the data was used to test the training of the model.
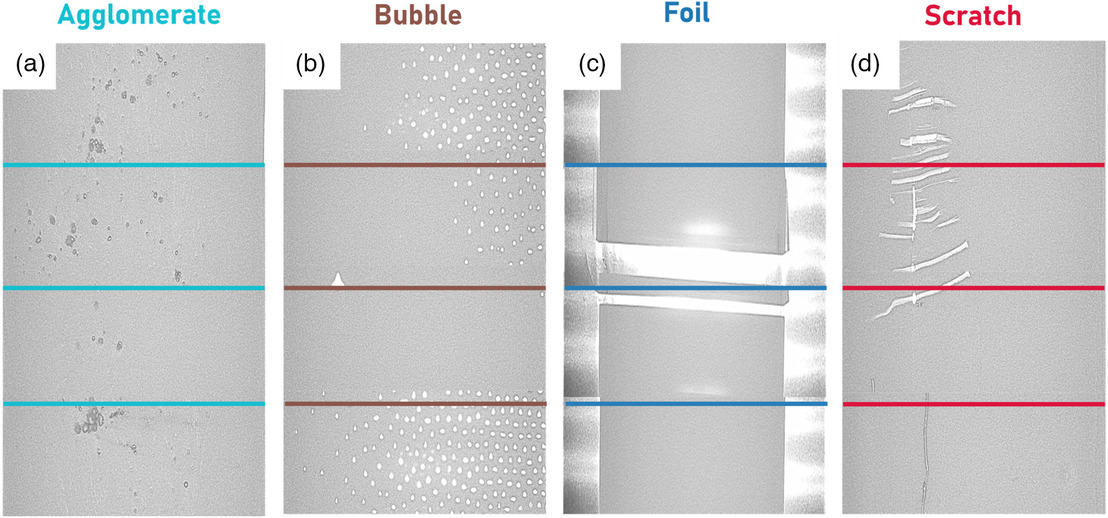
Exemplary images of defective electrodes captured by Cognex camera placed on the coating machine: a) a coarse accumulation of active material on the electrode surface is referred to as “agglomerate”; b) a hole on the electrode surface is called “bubble” or “pinhole”; c) the active material is coated on the metal foil and the foil is not a part of the electrode; therefore, the left and right side of the electrode is also considered as a defect and labeled as “foil.” The start and end part of the electrode also contains foil; d) a line on the electrode surface is annotated as “scratch.” The lines are created to separate the images and the colors are added to distinguish each defect class, i.e., each category has four images. Image Credit: Choudhary, N., et al., Advanced Intelligent Systems
Observations
After 280 epochs, the reported object-loss value was 0.09 and 0.02, with a drop of about 49% and 76% for the validation and training sets, respectively. For the validation and training sets, the model obtained 0.00033 and 0.00036 cls-loss, respectively. The model's class recall and mean accuracy was 84% and 88%, respectively, indicating a strong performance. Furthermore, the mean average precision (mAP) for all the classes together was 88%, thus determining the precision of the model’s detections. The individual classes recorded 98% mAP for bubbles, 65% mAP for agglomerates, 90% mAP for scratches, and 99% mAP for foil. During the prediction, the model attained an inference time of 9.5 ms. Agglomerates, bubbles, scratches, and foil were all predicted by the model.
Moreover, the suggested model could determine the spatial defect locations on the surface of the electrode, which was useful for establishing the relationship between the defects and input parameters. The faults were not evenly distributed on the surface of the electrode, and more defects on the right side of the photos were apparent, which could be resultant of the slit width not being precisely aligned. This link between the input parameters and defects could be used as a preventative method to decrease defects during the subsequent electrode's production.
Scratches and agglomerates exhibited a Gaussian distribution developed in the central region of the electrode and could be decreased by modifying the input parameters. The model was also able to detect nearly all the foils on either end of the electrode, but none in the image center. Additionally, one of the most common and frequently employed techniques, canny edge detection was utilized to identify the defect shapes. Since a lithium-ion battery's electrochemical performance is significantly associated with the incorporated electrode's quality, the information regarding the defect's shape and size can be useful for physics-based modeling.
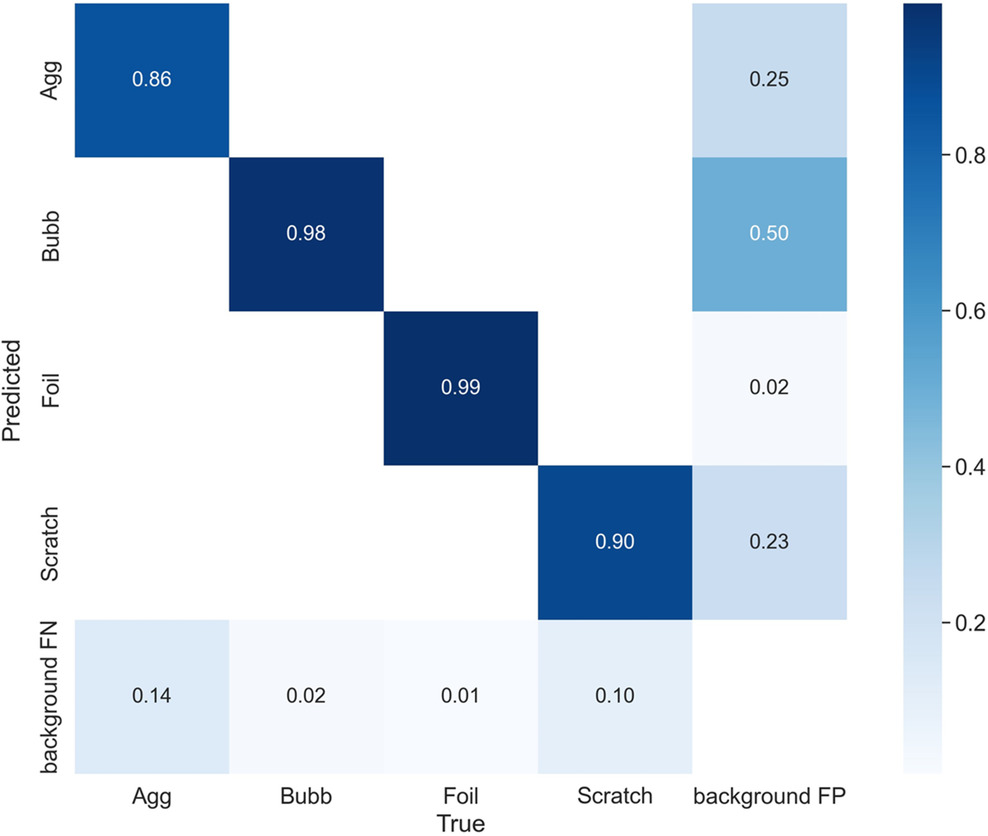
The confusion matrix showing the actual and predicted class labels for defects with the true positive (TP) rate on the diagonal and the last column showing the false positive (FP) rate. Foil class achieved the height precision and recall. Bubble class obtained higher recall as compared to precision. The model performed almost consistently while predicting the agglomerates and scratches. The model achieved a precision of 88%, a recall of 84%, and a 75% total accuracy. Image Credit: Choudhary, N., et al., Advanced Intelligent Systems
Conclusions
To summarize, the researchers proposed using YOLOv5, a deep learning-based object identification system, to detect defects in the initial stages of the electrode manufacturing process. The model accurately predicted individual defect classes in both dynamic (video) and static (image) datasets, with an 88% mAP for the combined classes. The model was capable of defect detection at a web speed of 9m s-1, thereby decreasing the time to ramp up and facilitating closed-loop optimization together with precise defect localization.
According to the authors, this study could be a preventative strategy for enhancing the electrode production quality. Additionally, the use of surrogate-trained, accurate, and fast models for detecting defects in battery manufacturing has demonstrated significantly faster prevention of defect-causing system states.
Reference
Choudhary, N., et al. Autonomous Visual Detection of Defects from Battery Electrode Manufacturing. Advanced Intelligent Systems, 2200142. doi.10.1002/aisy.202200142
Disclaimer: The views expressed here are those of the author expressed in their private capacity and do not necessarily represent the views of AZoM.com Limited T/A AZoNetwork the owner and operator of this website. This disclaimer forms part of the Terms and conditions of use of this website.