Polycondensation produces polyethylenterephthalate, a thermoplastic polymer that belongs to the Polyester group.
Image Credit: Anson_shutterstock/Shutterstock.com
PET is processed in many ways and has a wide range of applications. One of the most prevalent applications is the manufacturing of various types of plastic bottles (injection blow molding) and their conversion into textile fibers. PET is also used to create film footage, similar to what is shown in cinemas.
PET has been utilized in the creation of exceedingly thin cast films, sometimes known as Mylar, since the 1950s. PET contains its own resin identification code, making it easier to recycle PET packages. PET, as a textile fabric (Polyester), is popular due to its additional beneficial characteristics.
PET is crease-resistant, tearproof, weatherproof, and hydrophobic. As a result, PET is well suited to sportswear that requires quick drying. Even in the food industry, PET is the favored material. It can be treated into an amorphous state, which is completely achromatic and exceedingly translucent.
It is used for food grade packaging and bottling, such as the PET bottle. Because of its superior texture compatibility, PET is often employed as a base material for blood vessel implants. The glass transition temperature is around 80 °C. PET crystallizes at temperatures of around 140 °C. The melting point is approximately 235 °C to 260 °C.
Introduction
Melt extrusion is used to produce polyethyleneterephthalate (PET), which is then stretched up to six times its original length to create an infinite high-yield point thread.
To produce a consistent quality output, the processor is very interested in understanding how the flow properties of the molten polymer change as a function of temperature and shearing rate.
The Thermo Scientific™ HAAKE™ PolyLab System provides a quick and reliable way to examine these flow characteristics. Unlike typical capillary rheometers, test samples are monitored using a laboratory sensor extruder at conditions similar to those found during processing.
Materials and Methods
Test Set Up
PolyLab OS consists of:
- HAAKE™ Rheodrive drive unit with 4 kW
- HAAKE™ Rheomex 19/25 single screw extruder 19 mm with L:D = 25:1
- Screw 2:1
- Rod capillary die with rod capillary d = 1.5 mm and L:D = 20:1
- Die ring heater
Temperatures
Extruder:
- Zone 1 = 280 °C
- Zone 2 = 280 °C
- Zone 3 = 280 °C
Die ring heater: 280 °C
Die:
- Test = 275 °C
- Test = 285 °C
- Test = 295 °C
Results and Discussion
HAAKE™ PolySoft™ Software is used to analyze and evaluate test data. Diagram 1 shows the flow curves (shear stress vs shear rate), while diagram 2 shows the viscosity curves (viscosity versus shear rate).
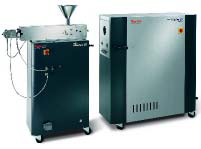
PolyLab OS. Image Credit: Thermo Fisher Scientific – Production Process & Analytics
The curves show the normal shear thinning effect for polymers. The charts indicate that the influence of temperature decreases with increasing shear rates for this product. At greater shear rates, the viscosity remains constant regardless of temperature variations.
Summary
To summarize, the flow properties of polymer melts vary depending on the processing temperature. This becomes particularly visible at low shear rates. As shear rates increase, this influence decreases.
At extremely high shear rates, the temperature effect can essentially be ignored. Thermo Fisher Scientific's PolyLab OS system provides a platform for customers to analyze these impacts and influences in conditions similar to those encountered during the manufacturing process.

Diagram 1. Shear stress against shear rate. Image Credit: Thermo Fisher Scientific – Production Process & Analytics
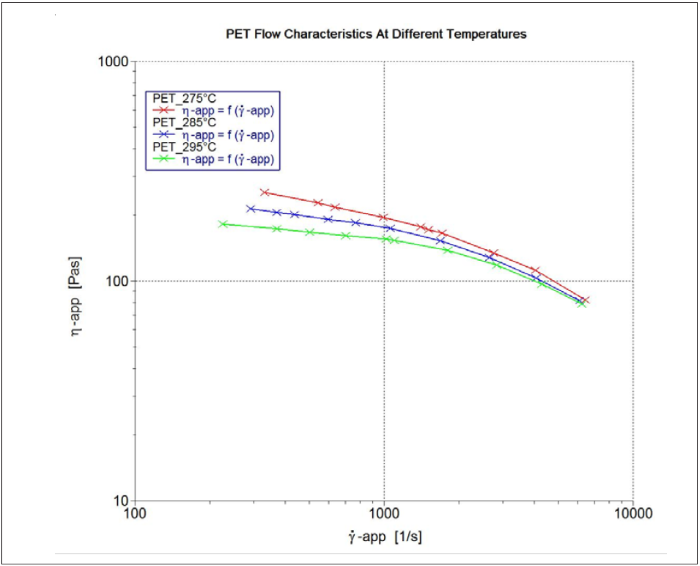
Diagram 2. Viscosity against shear rate. Image Credit: Thermo Fisher Scientific – Production Process & Analytics
Acknowledgments
This article was produced using materials originally authored by Thobias Geissler at Thermo Fisher Scientific.

This information has been sourced, reviewed and adapted from materials provided by Thermo Fisher Scientific – Material Characterization.
For more information on this source, please visit Thermo Fisher Scientific – Thermo Fisher Scientific - Material Characterization.