Understanding how polymers change structurally throughout the extrusion process is critical for optimizing extruded product production. Extrusion can change a polymer's structure and properties in ways that improve its performance and use.

Image Credit: Meaw_stocker/Shutterstock.com
Changes such as the transition from crystalline to amorphous phases or shifts in vibrational modes can be used to customize the end-polymer's mechanical, thermal, and optical properties to specific application requirements.
Polymer extrusion is a high-volume manufacturing method that involves melting raw plastic ingredients, such as low-density polyethylene (LDPE) and polylactic acid (PLA), and pushing them through a curved die to form specified and continuous profiles.
Twin-screw extruders use two intermeshing screws and a heating system to boost temperature, shear forces, and pressure, allowing the polymers to be melted and homogenized more efficiently. This procedure enables the manufacturing of a diverse range of plastic objects with consistent shapes and qualities.
Twin-screw extruders are also extensively employed in pharmaceutical applications to mix active pharmaceutical ingredients (APIs) with excipients. Extruders are used in battery manufacturing to fully mix the anode and cathode materials required for homogenous final products.
The Thermo Scientific™ Process™ 11 Parallel Twin-Screw Extruder is perfect for processing and compounding different materials in this way. Vibrational spectroscopic techniques, such as Raman spectroscopy, are frequently used for offline evaluation of extrusion products.
Integrating such techniques in line with the extruders can allow for real-time monitoring of several qualitative and quantitative elements of the process. Raman spectroscopy is a technique for detecting vibrational, rotational, and other low-frequency modes in a material.
Raman spectroscopy involves shining a monochromatic light source, usually a laser, onto a sample. The light scatters as it interacts with the sample's molecular vibrations.
Most of the scattered light has the same wavelength as the incident light (Rayleigh scattering), but a tiny percentage has variable wavelengths due to interactions with molecular vibrations.
This wavelength change creates a distinct spectral fingerprint for the material, which can be utilized to identify and classify the sample's chemical composition and structure.
Chemometric modeling techniques like partial least squares (PLS) regression and principal component analysis (PCA) can be used to convert this data into quantitative or qualitative information.
The Thermo Scientific™ MarqMetrix™ All-In-One Process Raman Analyzer integrates Raman spectroscopy into an extrusion process utilizing chemically resistant optical probes.
MarqMetrix probes can be inserted into extruder barrels, enabling continuous monitoring of the extrusion process and allowing for quantitative and qualitative judgments to be made in real-time. PCA is a sophisticated statistical technique that reduces the complexity of high-dimensional data while keeping key patterns and correlations.
By transforming the original variables into a new collection of uncorrelated variables known as principal components, PCA identifies the most important data variances. In Raman spectroscopy, PCA can be used to analyze spectral data and distinguish between different polymer types, such as LDPE or PLA.
By lowering the dimensionality of Raman spectra, PCA makes it easier to identify specific spectral signatures that distinguish LDPE from PLA.
This method improves spectral data clarity and allows for efficient and precise polymer categorization, making it a useful tool for quality control and process optimization in polymer extrusion.
This article uses PCA to evaluate Raman spectral data and efficiently discriminate between LDPE and PLA. This highlights the utility of Raman analysis in enhancing material identification and maintaining product uniformity in extrusion processes.
Benefits of Raman Spectroscopy in Polymer Extrusion
The integration of Raman spectroscopy into polymer extrusion processes represents a transformative possibility for the manufacturing industry.
Raman spectroscopy provides various advantages that can considerably improve the efficiency, quality, and overall performance of extrusion processes. This article investigates these advantages, emphasizing the value that Raman spectroscopy adds to the extrusion process.
Real-time monitoring: Raman spectroscopy allows for continuous monitoring of the chemical composition and molecular structure of polymers during extrusion.
This capability enables instantaneous process optimization – including temperature, throughput, and screw speed – to fix any deviations from intended material standards, ensuring that the extrusion process operates within ideal parameters. This results in better control over the extrusion process, increased efficiency, and less material waste.

MarqMetrix All-In-One process Raman analyzer. Image Credit: Thermo Fisher Scientific – Production Process & Analytics
Quality control: Having constant insights into the extrusion process ensures consistent and optimal product quality. Manufacturers can maintain high levels of product integrity by identifying and addressing concerns like contamination, poor mixing, or material degradation early in the process.
In addition, Raman spectroscopy provides quick feedback, which helps reduce the manufacturing of off-spec items and associated waste. This leads to significant cost reductions for both materials and production time, which contributes to overall operational efficiency.
Material identification: Raman spectroscopy can distinguish between different types of polymers and detect additives or fillers. This capacity is especially useful during material changeovers, as it ensures that the new material completely replaces the old material, reducing the possibility of cross-contamination.
Enhanced R&D capabilities: Raman spectroscopy provides significant insights into the effects of various extrusion parameters on polymer characteristics in R&D environments. This makes it easier to develop novel materials and methods, which drives polymer technology innovation and advancement.
Introduction
This article describes how the MarqMetrix All-In-One Process Raman Analyzer was integrated with the Process 11 Parallel Twin-Screw Extruder to allow for real-time observation of polymer processing within the extruder's barrel.
Raman spectroscopy was originally utilized to determine the differences between virgin material before extrusion and the same material during extrusion. It was then used to identify when materials had been blended and to trace the transition from one polymer to the next within the extruder system using qualitative chemometric models.
The materials employed in this study were LDPE and PLA. These materials were chosen because of their widespread use in end products across numerous industries, as well as their well-defined Raman spectra.
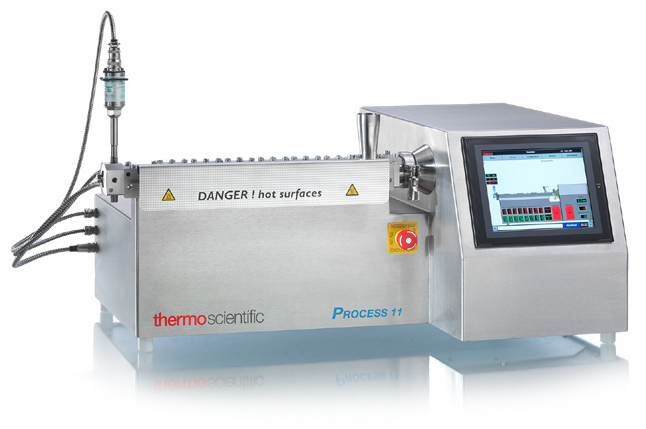
Process 11 twin-screw extruder. Image Credit: Thermo Fisher Scientific – Production Process & Analytics
Experimental Setup
The Process 11 extruder was connected to the MarqMetrix All-In-One analyzer (Figure 1).
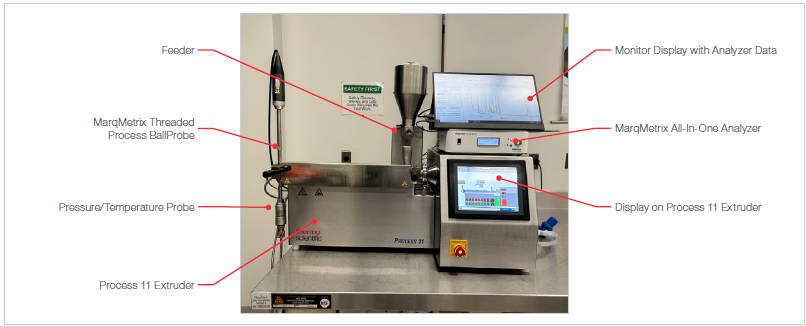
Figure 1. Experimental setup - Process 11 extruder with MarqMetrix All-In-One Raman analyzer. Image Credit: Thermo Fisher Scientific – Production Process & Analytics
The Process 11 extruder and MarqMetrix All-In-One analyzer were integrated with a Thermo Scientific™ MarqMetrix™ Threaded Process BallProbe Sampling Optic, which is precisely designed to fit directly in line with the extruder barrel.
The threaded probe has a screw design that allows the sapphire ball at the tip of the probe to make direct contact with the internally extruded material. This interaction with the substance allows for reliable and reproducible spectra collection.
The threaded probe is made of Hastelloy material, which has exceptional chemical resistance and a temperature rating of over 300 ºC. Figure 2 shows a comprehensive schematic of the probe.
The Process 11 extruder has eight (8) barrel segments (each 5L/D) for precise and independent temperature control, allowing the material to be heated to a specific temperature as it passes through the system. The feeder at the top of the extruder was used to send virgin pellets into the barrel.
Continuous scanning was carried out on the MarqMetrix All-In-One analyzer while polymer and process parameters were adjusted on the Process 11 extruder.
Spectra were acquired at a laser power of 450 mW, a one-second integration period, and three averages per scan. Each sample scan included an automated background scan, resulting in a total scan time of 6 seconds for each measurement.
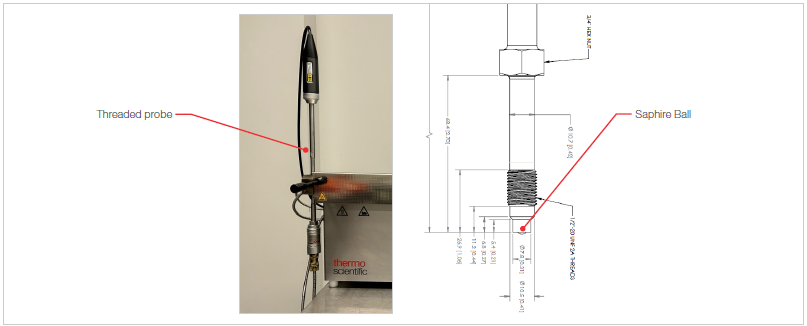
Figure 2. Threaded probe schematic. Image Credit: Thermo Fisher Scientific – Production Process & Analytics
Methodology
The Raman spectra of virgin LDPE and PLA pellets were initially collected to identify the unique spectral peaks and characteristics of the polymers. The polymer pellets were then fed concurrently through the extruder and continually examined by the threaded probe in the barrel as they extruded.
To determine alterations caused by the extrusion process, the obtained spectra were compared to those of virgin materials. In the second portion of the experiment, the MarqMetrix All-In-One analyzer was used to continually gather spectra from the barrel of the extruder in real time.
LDPE pellets were initially put into the extruder, followed by PLA, to allow for the examination of the resin changeover. The spectral data were utilized to monitor the resin changeover period under the precise process conditions listed in Table 1.
Results
Figure 3 shows the spectra of virgin LDPE and PLA pellets. LDPE and PLA have several distinguishing characteristics. Table 1 shows the extruder conditions across the barrel.
Table 2 shows the glass transition temperature and melting points for LDPE and PLA. The extruder's temperature parameters allowed both materials to remain molten during the extrusion process.
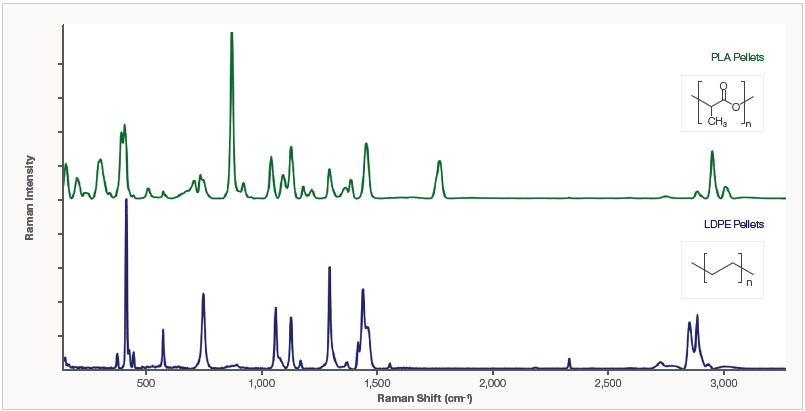
Figure 3. Raman spectra of virgin PLA and LDPE pellets. Image Credit: Thermo Fisher Scientific – Production Process & Analytics
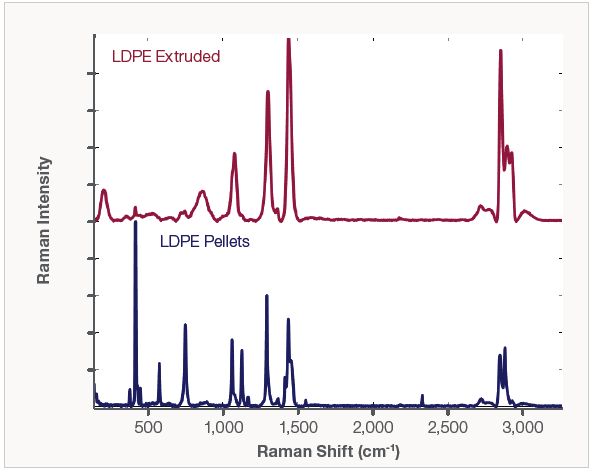
Figure 4. Raman spectra of virgin pellets and extruded LDPE. Image Credit: Thermo Fisher Scientific – Production Process & Analytics
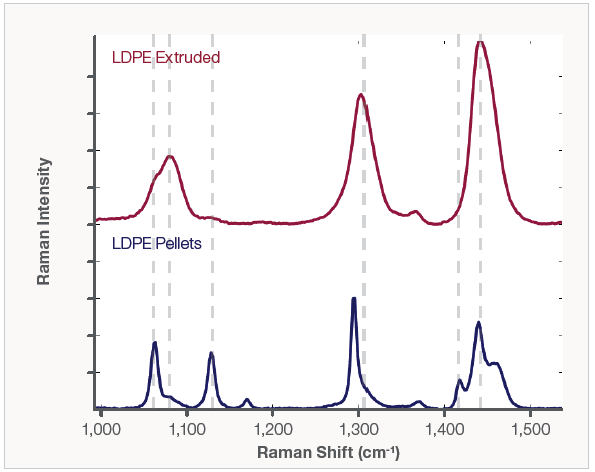
Figure 5. Raman spectra of virgin and extruded LDPE highlighting the fingerprint region. Image Credit: Thermo Fisher Scientific – Production Process & Analytics
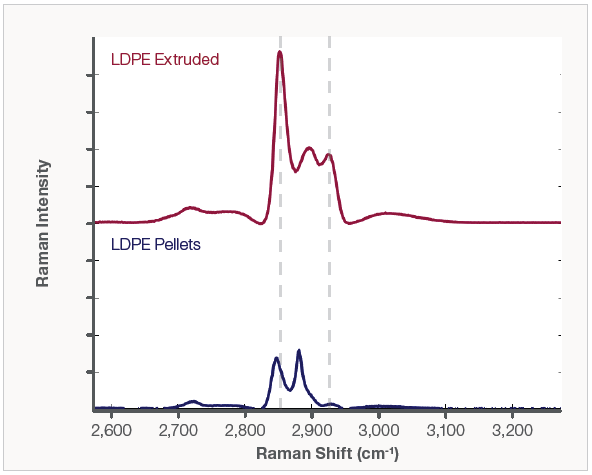
Figure 6. Raman spectra of virgin and extruded LDPE, highlighting the C-H stretch region. Image Credit: Thermo Fisher Scientific – Production Process & Analytics
Table 1. Summary of Process 11 extruder temperature and set parameter conditions. Source: Thermo Fisher Scientific – Production Process & Analytics
| Condition |
Material |
Set temperature (°C) |
Set parameters |
Monitored parameters |
|
|
Die |
Zone 8 |
Zone 7 |
Zone 6 |
Zone 5 |
Zone 4 |
Zone 3 |
Zone 2 |
Melt temperature |
Feed rate (%) |
Screw Speed (RPM) |
Pressure (bar) |
Torque (%) |
| A |
LDPE |
160 |
160 |
160 |
160 |
160 |
155 |
150 |
130 |
163 |
4 |
200 |
0 |
15 |
| B |
LDPE |
175 |
180 |
175 |
175 |
170 |
165 |
160 |
140 |
176 |
5 |
300 |
0 |
22 |
| C |
PLA |
175 |
180 |
175 |
175 |
170 |
165 |
160 |
140 |
176 |
5 |
300 |
0 |
17 |
Table 2. Glass transition and melting temperature by material. Source: Thermo Fisher Scientific – Production Process & Analytics
| Material |
Glass transition temperature |
Melting point temperature |
| LDPE |
-110 °C |
105 –110 °C |
| PLA |
55 – 65 °C |
150 –160 °C |
The analysis of Figure 4's inline Raman data revealed numerous critical conclusions about LDPE structural changes during the extrusion process. Methylene bending vibration (δ(CH2)) bands were detected between 1,400 and 1,480 cm-1, with a peak at 1,416 cm-1, suggesting the crystalline phase.
This peak was present in pellet samples but not in extruded samples, indicating that the crystal phase melted during the extrusion process. This area is shown in Figure 5. Peaks at 1,080 and 1,303 cm-1 corresponded to the amorphous phase of LDPE.
These peaks were absent or minor in pellet samples but evident in extruded samples, implying that the extruded sample was almost totally amorphous. All-trans PE chains exhibit symmetric and asymmetric C-C stretching vibrations, as seen by peaks at 1,063 and 1,123 cm-1.
These peaks were clearly visible in LDPE pellets, showing the existence of alltrans chains. However, in extruded samples, these peaks were attenuated or nonexistent, indicating a break in 1D translational periodicity during melting.
This is also seen in Figure 5. Infrared and Raman spectroscopy show that the range between 2800 and 3000 cm-1 corresponds to C-H stretching vibrational modes. The Raman spectra of extruded LDPE also showed considerable variations in the heights and ratios of the peaks in the C-H stretch region (Figure 6).
Overall, the Raman analysis revealed considerable differences between the crystalline and amorphous phases of LDPE in pellet and extruded samples, emphasizing the structural changes that occur throughout the extrusion process.
As stated in Table 1, the process settings for LDPE were changed to "B" to see how temperature, screw speed, and feed rate would affect the structure.
As shown in Figure 7, there were no significant differences between the spectra of the A and B processing conditions. This indicates that the polymer was already completely melted under the specified conditions in condition A.
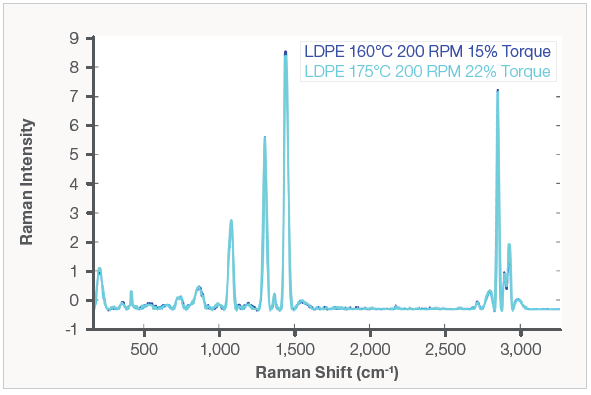
Figure 7. Raman spectra of LDPE under varying process conditions (temperature and screw torque). Image Credit: Thermo Fisher Scientific – Production Process & Analytics
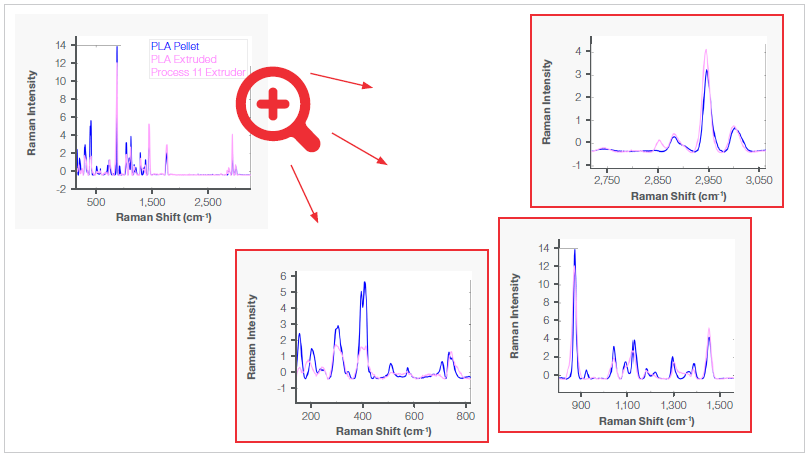
Figure 8. Raman spectra of virgin and extruded PLA. Image Credit: Thermo Fisher Scientific – Production Process & Analytics
The virgin and extruded spectra of PLA were also evaluated. Figure 8 shows that the extruded PLA spectra had unique features when compared to the virgin pellets. In the following portion of the experiment, a PCA model was developed to clearly identify each polymer.
The PCA model was used to monitor the presence of each component in the extruder barrel during the resin changeover. LDPE was extruded at a consistent rate. When the feeder was empty, the PLA was injected into the system, and the process was monitored.
The threaded probe attached to the end of the die offered continuous measurement every 6 seconds during the changeover operation. Figure 8 shows the Raman spectra of the system from 0 to 30 seconds. When PLA was injected into the feeder, the timer was set at zero seconds.
Figure 9 shows that the spectra remain unaltered, showing that only LDPE was purged through the barrel's end. Figure 10 depicts the Raman spectra from 30 to 60 seconds.
After the first 30 seconds, the Raman spectra began to alter dramatically, indicating that some of the PLA had reached the probe down the extruder's barrel. The PCA model was very useful in identifying the changeover process.
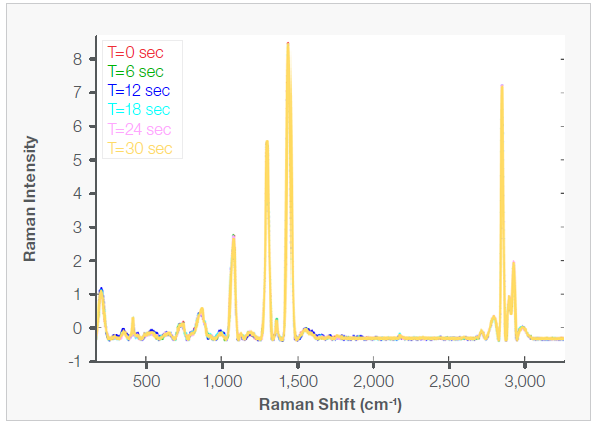
Figure 9. Raman spectra monitoring of LDPE to PLA from 0 to 30 seconds. Image Credit: Thermo Fisher Scientific – Production Process & Analytics
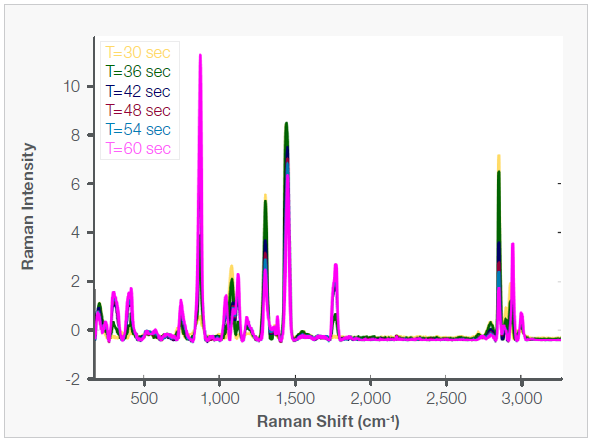
Figure 10. Raman spectra monitoring of LDPE to PLA from 30 to 60 seconds. Image Credit: Thermo Fisher Scientific – Production Process & Analytics
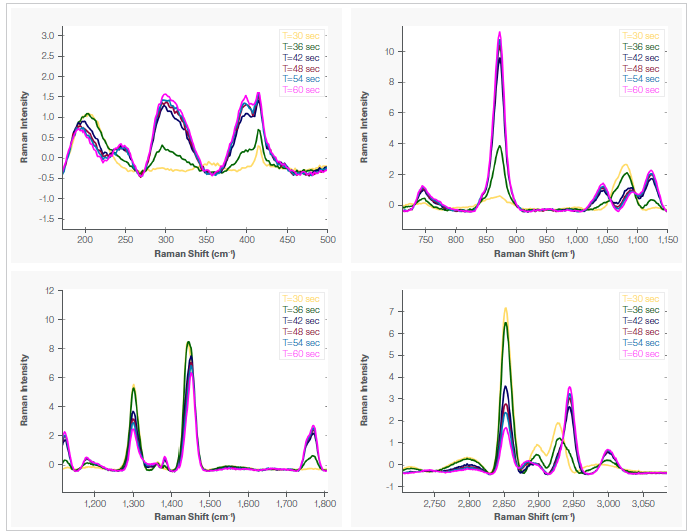
Figure 11. Raman spectra monitoring LDPE to PLA from 30 to 60 seconds, highlighting different spectral regions. Image Credit: Thermo Fisher Scientific – Production Process & Analytics
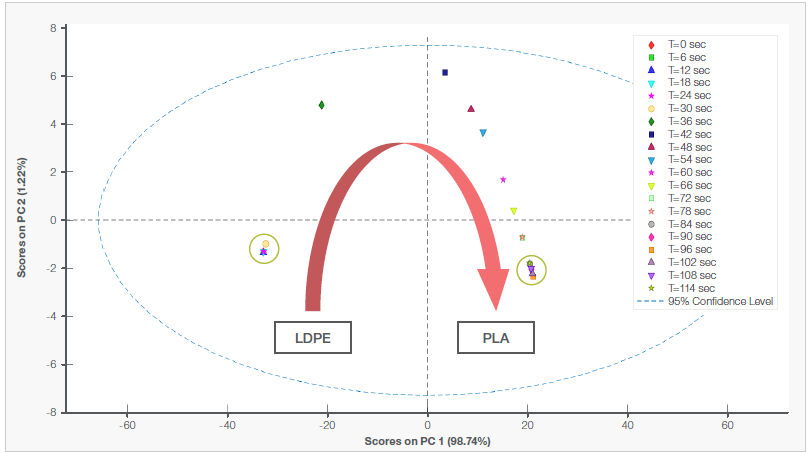
Figure 12. PCA plot highlighting transition from LDPE to PLA. Image Credit: Thermo Fisher Scientific – Production Process & Analytics
In Figure 11, spectral characteristics for PLA begin to appear in the spectra between 30 and 60 seconds. The LDPE peaks eventually faded away. Figure 12 depicts the PCA plot for the full run, which lasted 114 seconds.
The PCA plot clearly shows the polymer transition and stabilization process during extrusion. Initially, the LDPE appears as a separate cluster to the left on a PCA plot, showing its presence for 30 seconds.
As PLA is injected, the plot undergoes a transitional phase marked by the emergence of new spectral characteristics, indicating the eventual replacement of LDPE with PLA. Finally, after 84 seconds, the process settles into a well-defined PLA cluster.
This demonstrates the efficacy of PCA in tracking and discriminating between different polymers in real time.
Conclusion
The combination of the MarqMetrix All-In-One Process Raman Analyzer with the Process 11 Parallel Twin-Screw Extruder has shown considerable benefits for real-time, inline process monitoring in polymer extrusion.
This study demonstrated the ability of Raman spectroscopy to distinguish between solid and liquid states of polymers and to identify transitions from one polymer to another using PCA models.
Such information can be used to prevent cross-contamination during polymer changeovers and to ensure the quality of extruded polymers. This proof-of-concept study can be extended to quantify the composition of composite polymer materials using PLS models.
The MarqMetrix All-In-One analyzer can be installed mid-barrel to monitor reactive extrusion in real time. Overall, incorporating Raman spectroscopy into polymer extrusion processes provides numerous advantages, including real-time monitoring and quality control, process optimization, and cost savings.
These benefits make Raman spectroscopy an invaluable tool for increasing the efficiency and effectiveness of polymer extrusion operations.
Acknowledgments
This article has been produced using materials originally authored by Janam Pandya, Lucivan Barros, and Salvador Alvadado-Olivo from Thermo Scientific - Chemical Analysis - Production Process and Analytics (PPA).
References
- Lu, R., et al. (2005). C−H Stretching Vibrations of Methyl, Methylene and Methine Groups at the Vapor/Alcohol (n = 1−8) Interfaces. Journal of Physical Chemistry B, 109(29), pp.14118–14129. DOI: 10.1021/jp051565q. https://pubs.acs.org/doi/10.1021/jp051565q.
- Bolskis, E., Adomaviciute, E. and Griškonis, E. (2022). Formation and Investigation of Mechanical, Thermal, Optical and Wetting Properties of Melt-Spun Multifilament Poly(lactic acid) Yarns with Added Rosins. Polymers, 14(3), p.379. DOI: 10.3390/polym14030379. https://www.mdpi.com/2073-4360/14/3/379.

This information has been sourced, reviewed and adapted from materials provided by Thermo Fisher Scientific – Production Process & Analytics.
For more information on this source, please visit Thermo Fisher Scientific.