The msRepeatFinder visualizes complex mass spectrum data, helping to accelerate interpretation and information sharing.
Key Features
Kendrick Mass Defect (KMD) Analysis and Its Application to Synthetic Polymers
Developed in 1963 by Edward Kendrick, the Kendrick Mass Defect (KMD) analysis is still used in the petrochemical industry to analyze complex mixtures. In mass spectrometry, an accurate mass acquired by a high-resolution mass spectrometer uses a unit system with a mass of 12C equal to 12.0000 u. In contrast, Kendrick mass (KM) uses a unit system of CH2 = 14.00000.
Using the KM analysis method, the mass spectrum peaks of an extremely complex mixture mostly composed of hydrocarbons, such as crude oil, can be identified based on the degree of unsaturation of the hydrocarbons and the presence of heteroatoms.
JEOL Ltd. and the National Institute of Advanced Industrial Science and Technology (AIST) have successfully applied the KMD method to the investigation of high-resolution mass spectra of polymers. They have defined KM so that the exact mass of the monomer is an integer.
Generating a KMD plot allows polymer scientists to visualize the types and numbers of polymers in complex mass spectra without assigning individual peaks.
Recently, the Fraction Base KMD and Remainder KM methods have been offered to analyze polymers across an extensive mass range and structurally analyze polymers using MS/MS. These KMD technologies not only reduce the time required for polymer analysis but also simplify information sharing.
How Polymers Appear on KMD Plot
Understanding how polymers are represented in KMD and KMR (Kendrick Mass Remainder) plots aids in their analysis. The horizontal axis in the KMD figure below represents the integer part of KM, also known as nominal KM. The vertical axis represents the KMD, the difference between the nominal KM and the KM.
In KMD analysis, one monomer must be set first. On the KMD plot, the mass spectral peaks of the monomer-based polymer are parallel to the horizontal axis. Because the end group influences the KMD value, mixtures of homopolymers with different end groups often produce multiple horizontal series.
KMR plots can be used to represent mixtures of homologous polymers with various end groups. The horizontal axis represents the remainder of the nominal Kendrick mass divided by the nominal mass of the monomer. Polymers with the same end group are difficult to discern in KMR plots as they are aggregated at a single point, but homopolymers with different end groups, which are difficult to discern on the KMD plot, are readily detected here.
KMD Plot
- The specified monomers are arranged in a series parallel to the horizontal axis.
- Visualization of polymer type / molecular weight distribution.
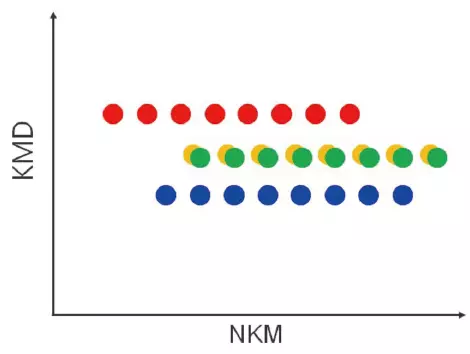
Image Credit: JEOL USA, Inc.
KMR Plot
- The same monomer and end groups are combined into a single point in a series.
- A KMD plot can be used to identify series that are hard to separate.
- The molecular weight distribution is used with a KMD plot because it is not visual.
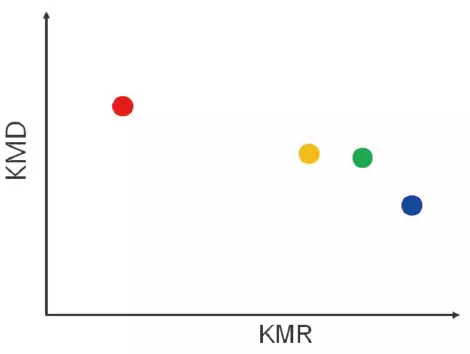
Image Credit: JEOL USA, Inc.
On the KMD plot, polymers formed of monomers outside the specified monomer are easily identified. They are represented as diagonal lines on the KMD plot, whilst those composed of the selected monomer are parallel to the x-axis.
For a copolymer in a binary system, for example, the constituent units are made up of two different types of monomers. When one monomer is selected, it will be distributed parallel to the horizontal axis, while the other monomer will be distributed diagonally. The KMD plot depicts each monomer's distribution as a grid of parallelograms.
For a Mixture of Different Polymer Species
When a specific monomer is selected, the polymers containing that monomer are lined up parallel to the horizontal axis, while the other polymers are lined up diagonally.
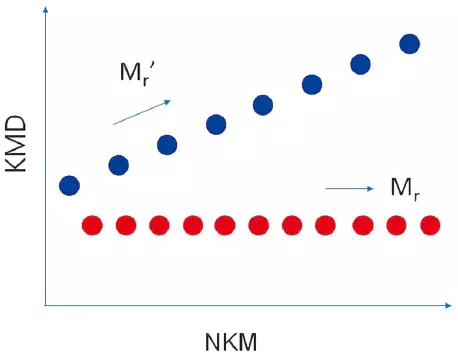
Image Credit: JEOL USA, Inc.
For Binary Copolymers
A grid pattern is produced due to the distribution of the two monomers.
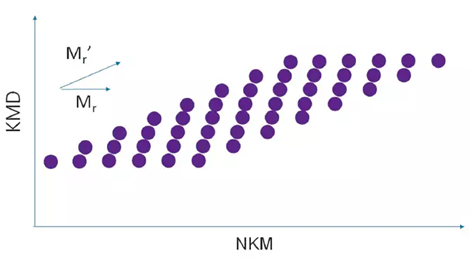
Image Credit: JEOL USA, Inc.
End-Group Analysis of Polymers by Using a High Mass-Resolution MALDI-TOFMS
Homopolymer mixtures with distinct end groups can be sorted and grouped using the msRepeatFinder with the ultra-high mass-resolution MALDI-TOFMS JMS-S3000 SpiralTOF™ series.
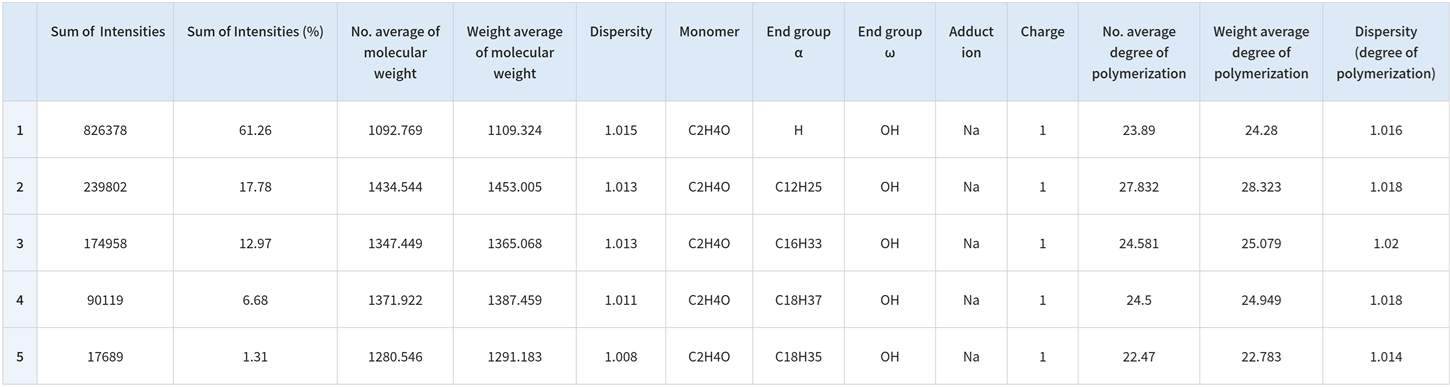
It is also possible to search for and group the points on the KMD plot based on the makeup of the end groups. The table displays the computed relative ionic intensities and polymer index values for the grouped series.
The KMD plot in the following example shows at least four series with separate end groups. The KMR (Kendrick Mass Remainder) plot can be used to check that there are five series.
MALDI Mass Spectrum, KMD Plot, and KMR Plot of a Polyethylene Oxide Mixture with Different End Groups
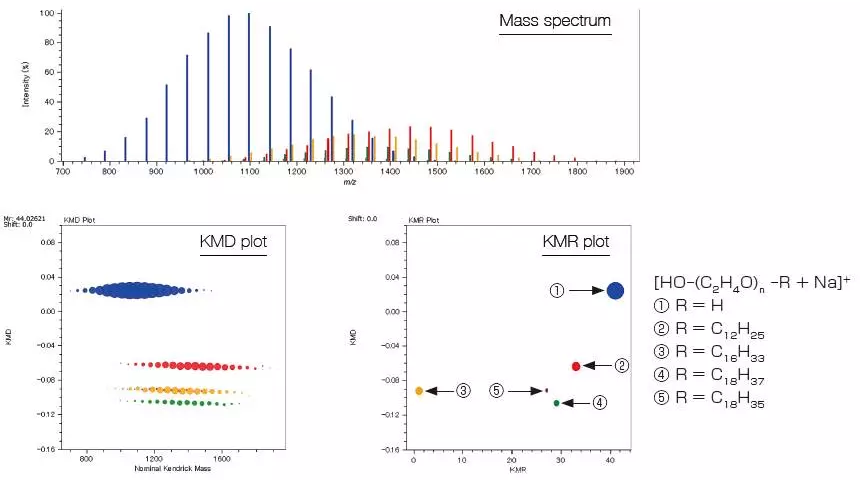
Image Credit: JEOL USA, Inc.
Source: JEOL USA, Inc.
Elucidation of End-Group Structures from Accurate Mass Measurement Using High-Resolution MALDI-TOFMS and MS/MS Measurement (Product Ion Mass Spectrum)
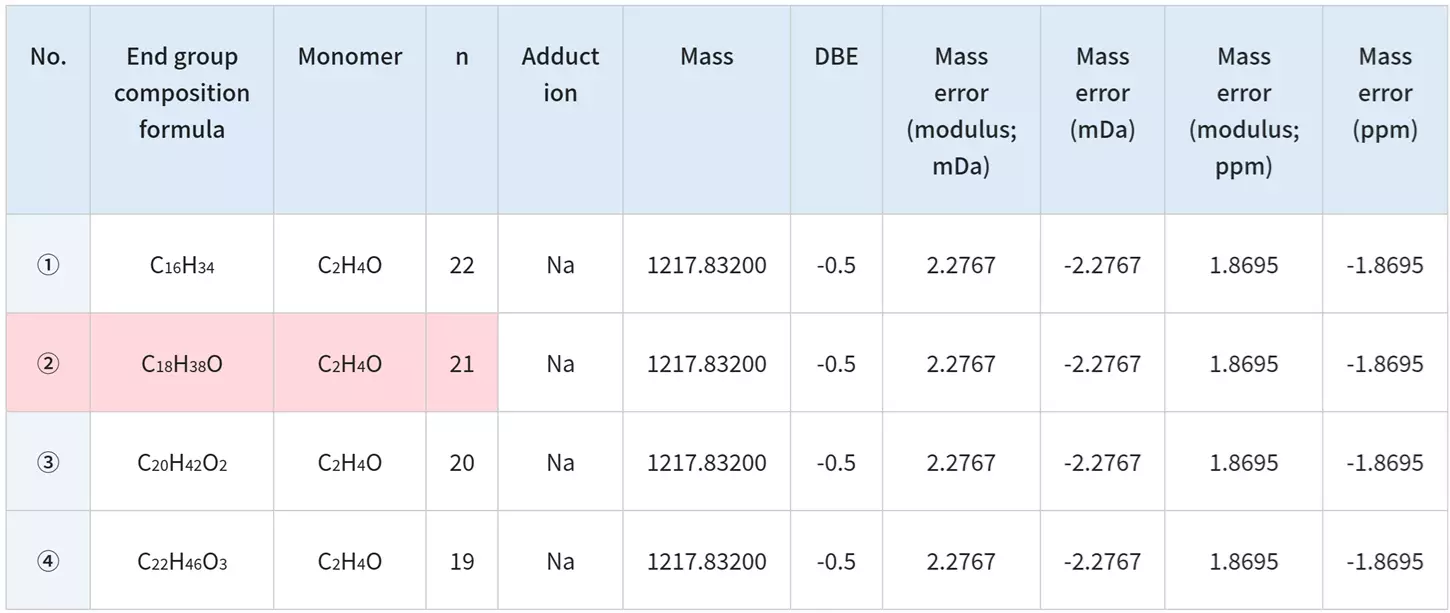
The msRepeatFinder can determine the elemental makeup of ions by using the accurately obtained mass. The elemental makeup of the end group for group 4 is presented below. The four candidates share the same elemental composition but exhibit varying degrees of polymerization. The information generated from the product ion mass spectrum is used to narrow down the candidates.
A peak at m/z 23 in the product ion mass spectrum can be identified as a Na ion adduct. The characteristic neutral loss seen suggests that one end group has a size of approximately 254 u, whilst the other is much smaller. Taking this into account, the polymer was determined to be polyethylene oxide with an end group of C18H37/OH.
Source: JEOL USA, Inc.
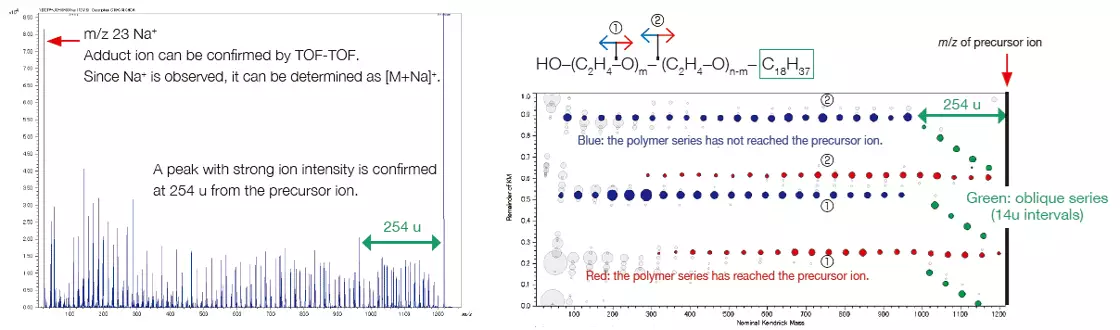
Product-ion mass spectrum and RKM plot of group 4. Image Credit: JEOL USA, Inc.
Deisotope
The deisotoping function simplifies KMD, KMR, and RKM displays by combining the ionic strengths of isotopic peaks into monoisotopic peaks. Discrepancies in isotope patterns due to molecular weight are avoided because the ion intensity is aggregated at the monoisotopic peak. This makes the molecular weight distribution more intuitively understood.
MALDI Mass Spectrum of a PMMA Standard Mixture
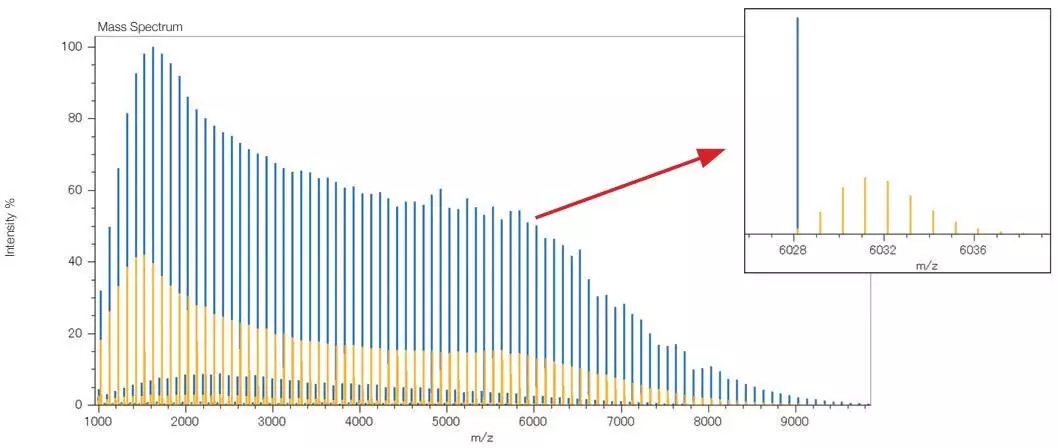
Yellow: before deisotoping, Blue: after deisotoping. Image Credit: JEOL USA, Inc.
KMD Plots of a PMMA Standard Mixture
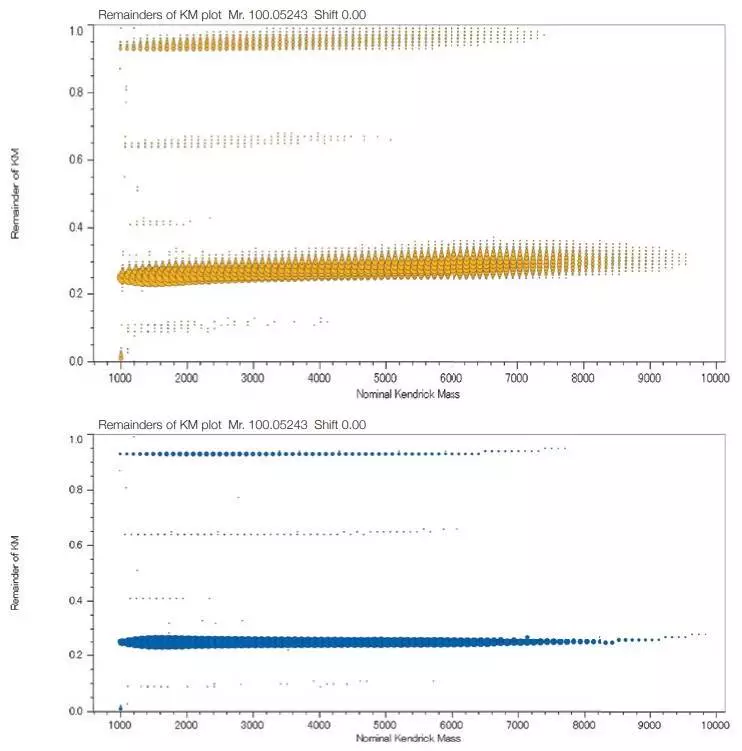
Top: before deisotoping, Bottom: after deisotoping. Image Credit: JEOL USA, Inc.
Analysis of Copolymers by Using a High-Resolution MALDI-TOFMS
Copolymers are made up of two or more monomer species and require high mass-resolution analysis. An ultra-high mass resolution MALDI-TOFMS can distinguish between several isobaric ion peaks (which have the same nominal mass but differing accurate mass) on a mass spectrum.
Assigning peaks one by one on a copolymer mass spectrum is impractical due to the inherent complexity of the plot. KMD analysis using msRepeatFinder allows users to visualize the distribution of polymer species.
The following spectra examine an EO-PO block copolymer.
The expanded mass spectrum demonstrates that peaks less than 0.03 u apart are clearly separated by a high mass resolution. A KMD figure (base unit: PO) visualizes the data in the mass spectrum, reflecting the PO distribution on the horizontal axis and the EO distribution on the diagonal.
Fraction Base KMD plots provide a more detailed view of the polymer series than conventional KMD plots.
Mass Spectrum of EO-PO Block Copolymer
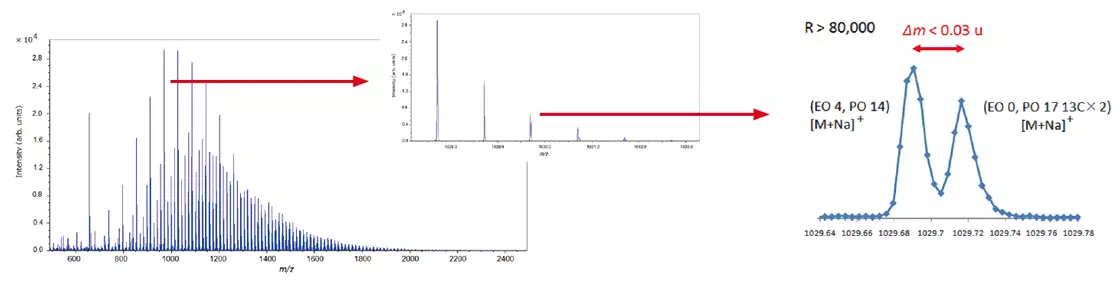
Image Credit: JEOL USA, Inc.
KMD Plot (Left) / Fraction Base KMD Plot (Right)
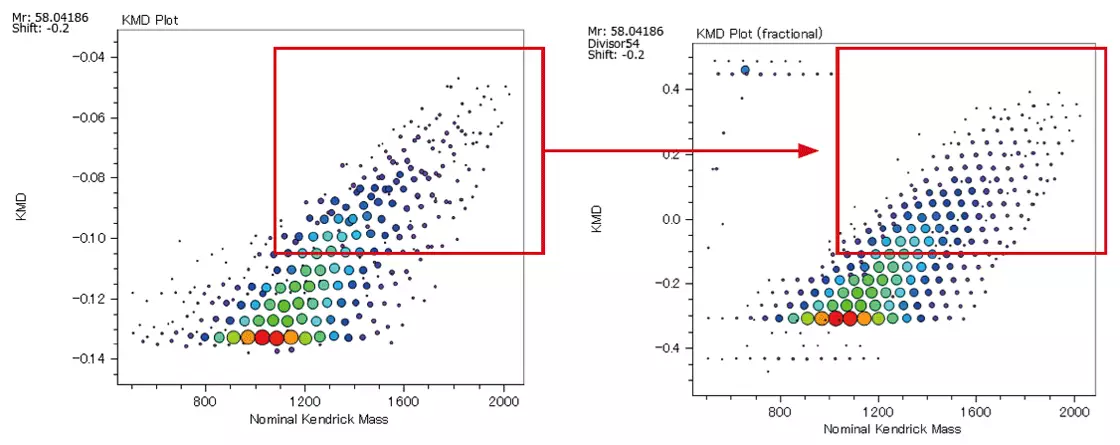
Image Credit: JEOL USA, Inc.
The pattern on the KMD plot can be used to determine the ratio of the two monomers in the binary copolymer and the difference in the copolymers' synthetic processes. The mass spectra and KMD plots (base unit: PO) for two EO-PO copolymers with roughly identical average molecular weights are shown below.
A minor amount of PO homopolymer was found in the mass spectrum and KMD plot of the PO-EO-PO block copolymer. This is considered one of the proofs that this sample is a block copolymer, as the presence of residual EO or PO homopolymers in randomly polymerized EO-PO copolymers is implausible given the copolymer synthesis procedure.
In contrast, the KMD figure for the EO-PO random copolymer indicates that the numeric distribution of EO monomers is large. By specifying the end groups, it is also possible to generate a degree of polymerization (DP) plot, along with calculated EO and PO molar and weight ratios.
The weight ratios of the PO-EO-PO block copolymers are consistent with reported values. For EO/PO random copolymers with unknown composition, the EO/PO ratio can be estimated from the mass spectral data.
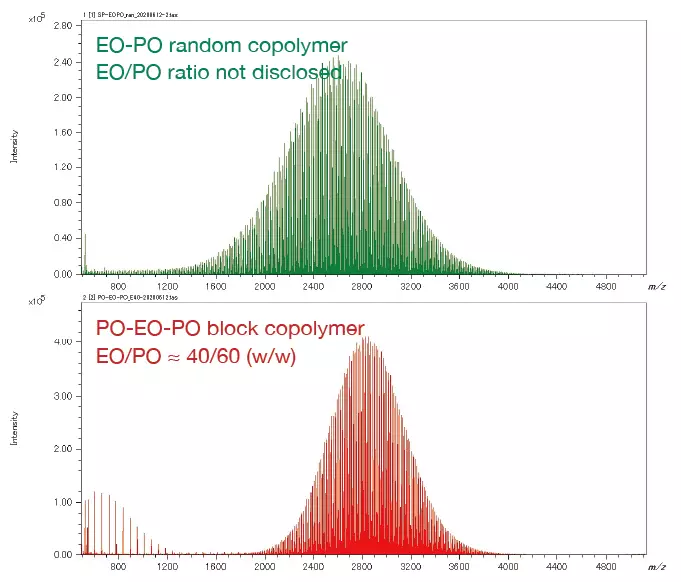
Mass Spectra of EO-PO random copolymer and PO-EO-PO block copolymer. Image Credit: JEOL USA, Inc.
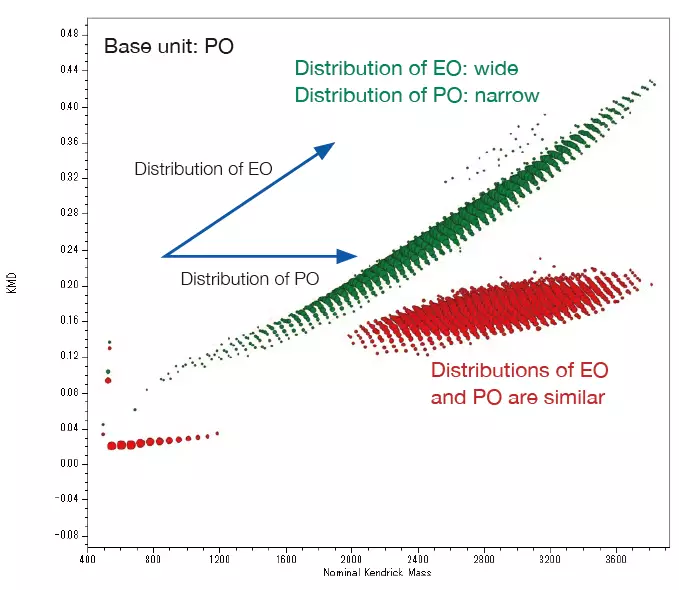
Overlaid KMD plot of EO-PO random copolymer and PO-EO-PO block copolymer. Image Credit: JEOL USA, Inc.
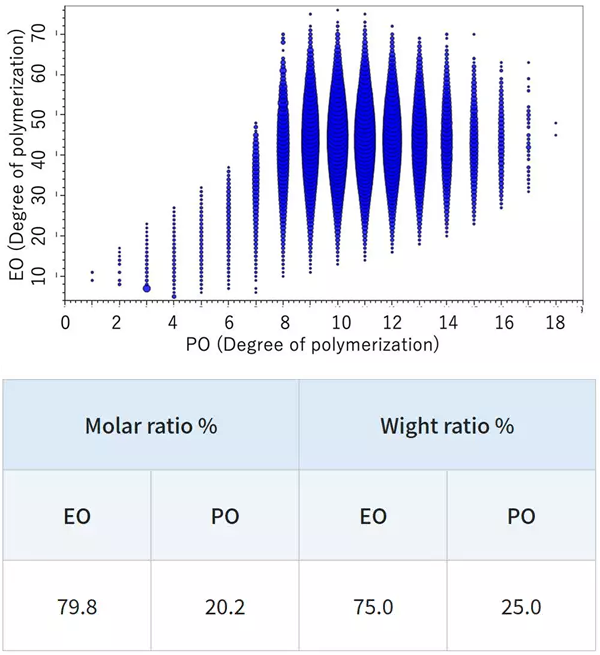
DP plot of the EO-PO random copolymer. Image Credit: JEOL USA, Inc.
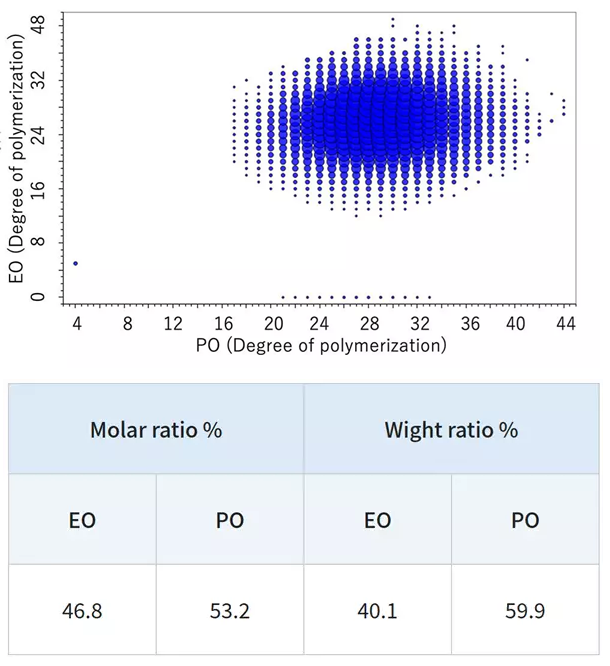
DP plot of the EO-PO block copolymer. Image Credit: JEOL USA, Inc.
Differential Analysis of 2 Polymer Samples
Comparing end groups and molecular weight distributions is key to detecting sample degradation, batch-to-batch variation, or changes in synthesis conditions. The optional msRepeatFinder allows for two samples to be subjected to differential analysis. One example is its use in assessing the degradation of polyethylene terephthalate, shown below.
The mass spectrum presents the change in composition before and after degradation. Cyclic oligomers and series with COOH/COOH end groups were identified as the main components before and during degradation. Each sample was measured three times to ensure reliable differential analysis.
The results of differential analysis are displayed in the KMD plots below. Stronger peaks prior to degradation are shown in red, and stronger peaks following degradation are shown in green. A volcano plot can be made to further validate the components that differ between the two samples with statistical significance.
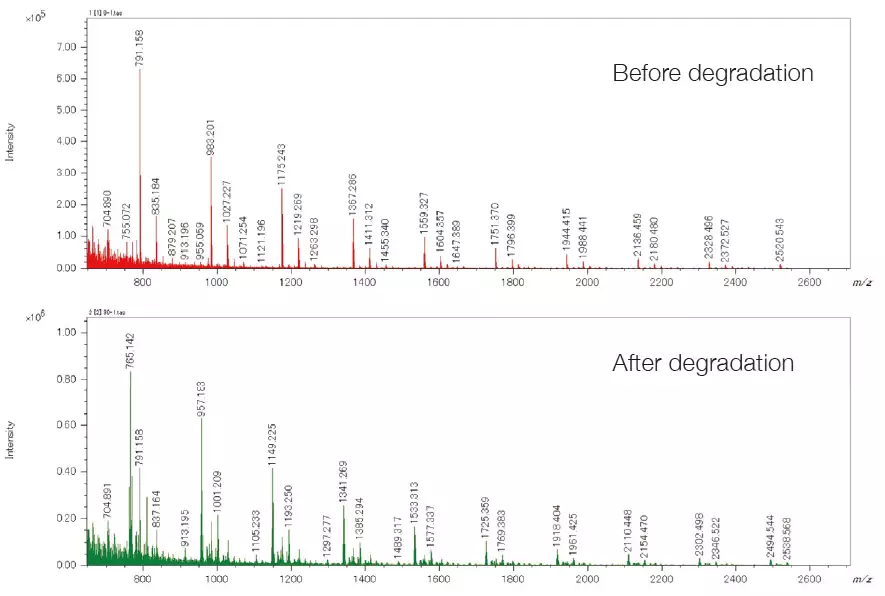
Mass spectra of PET samples before and after degradation. Image Credit: JEOL USA, Inc.
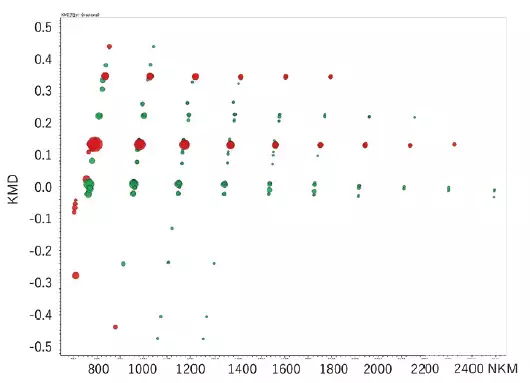
KMD plot of differential analysis result. Image Credit: JEOL USA, Inc.
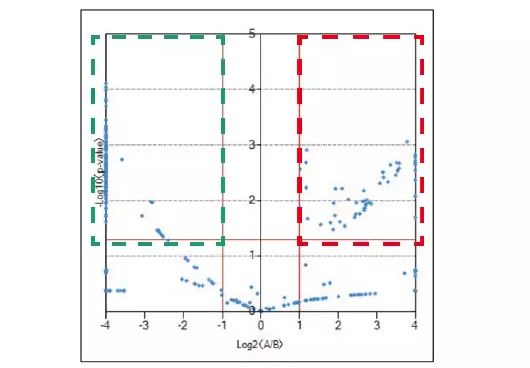
Volcano plot of differential analysis result. Image Credit: JEOL USA, Inc.
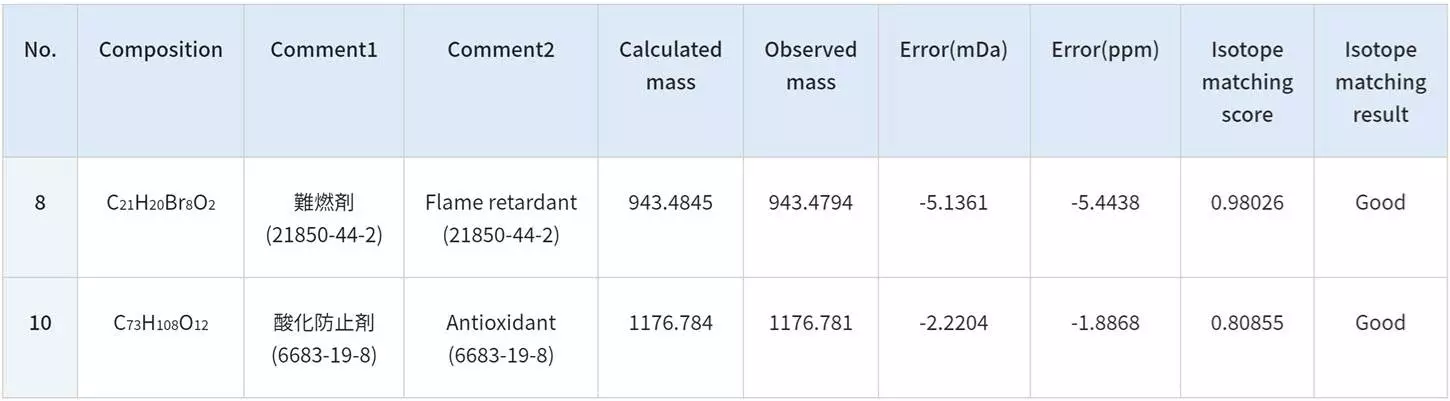
Identification of Additives in Polymers by FD (Field Desorption)
The compound list search function uses precise mass and isotope pattern to look for compounds listed in a compound list. There is a list of approximately 400 polymer additives that are often used.
The example below displays the results of investigating polymer additives with the JMS-T2000GC AccuTOFTM GC-Alpha to measure the FD mass spectrum of a solvent extract of a commercial polypropylene product. The results revealed the presence of an antioxidant (CAS No. 6683-19-8) and a flame retardant (CAS No. 21850-44-2).
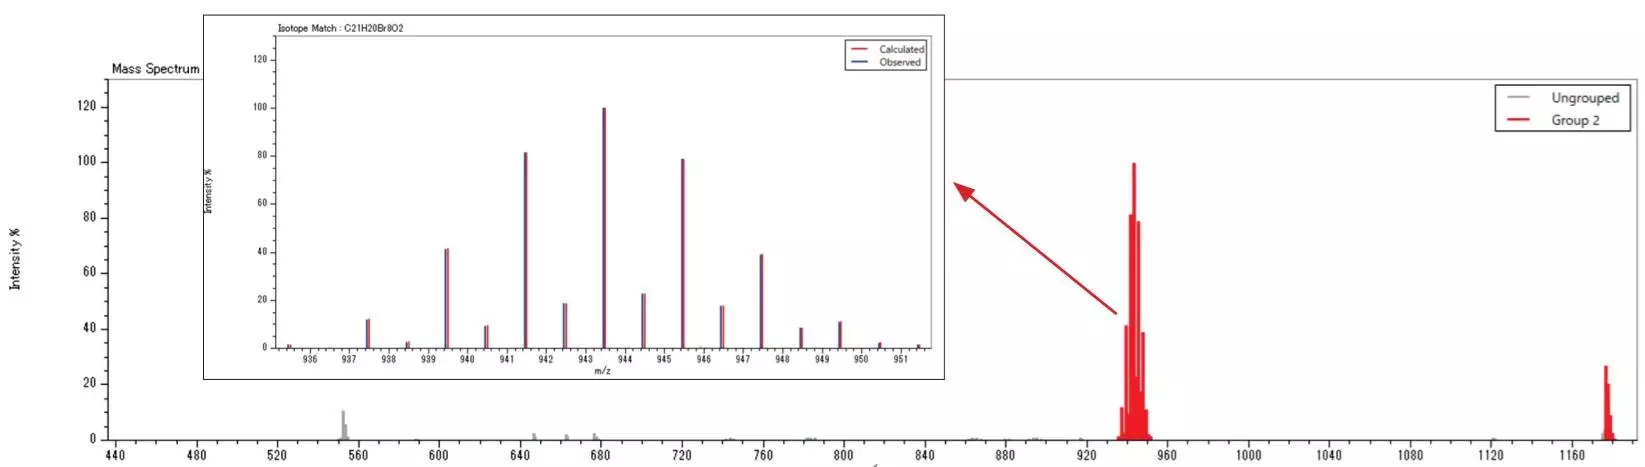
Image Credit: JEOL USA, Inc.
The user can establish a compound list based on the molecular formula and an ID (compound name, CAS number, etc.) for the compound to be searched.
Source: JEOL USA, Inc.
Analysis of Crude Oil with FD and KMD Analysis / Group-Type Analysis
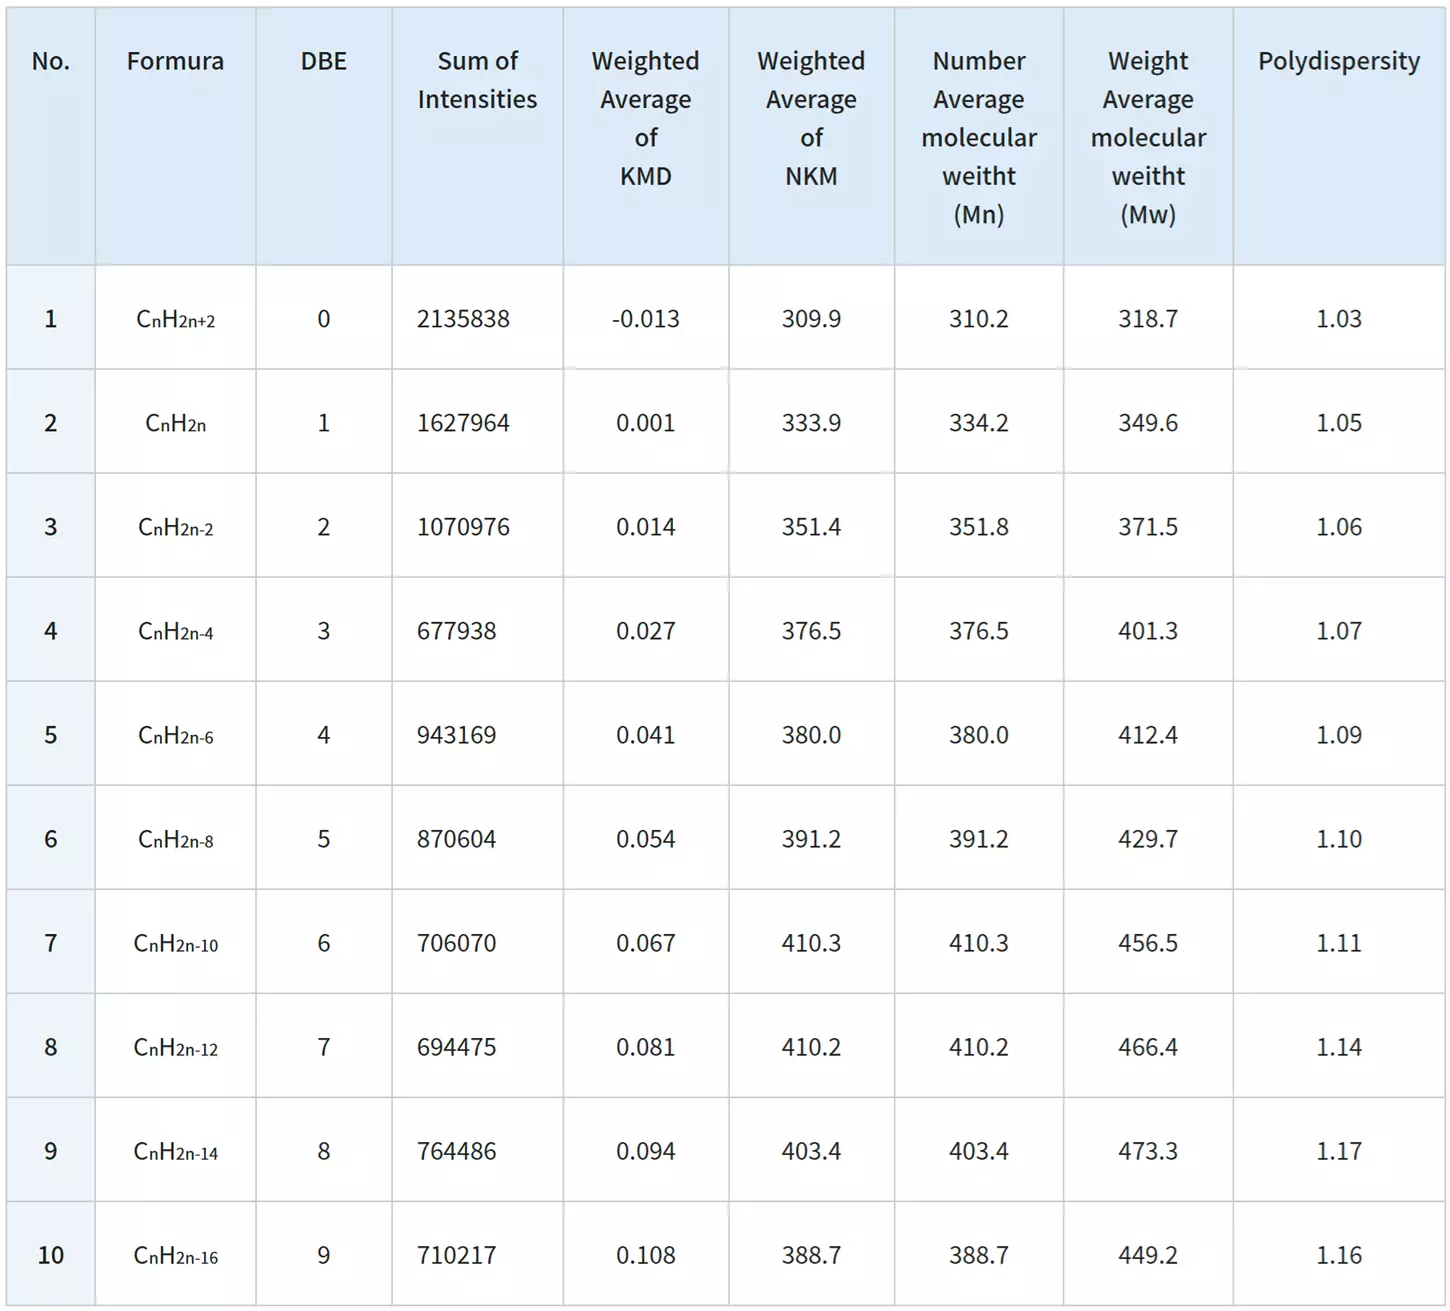
The msRepeatFinder software can also be used for KMD and group-type hydrocarbon analysis. The FD mass spectrum and KMD plot of crude oil were measured using the JMS-T2000GC AccuTOF™ GC-Alpha, a high-resolution GC-TOFMS with an EI/FI/FD combination ion source. Visualizing the series of hydrocarbons with varying degrees of unsaturation allows for easy grouping, and the following indicators are automatically calculated for each series.
- Sum of intensities
- Number average molecular weight
- Weight average molecular weight
After viewing the mass spectrum on the KMD plot, a thorough group-type analysis can be done:
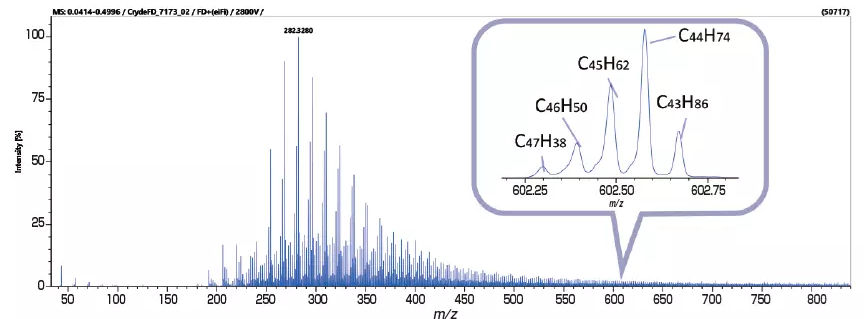
Image Credit: JEOL USA, Inc.
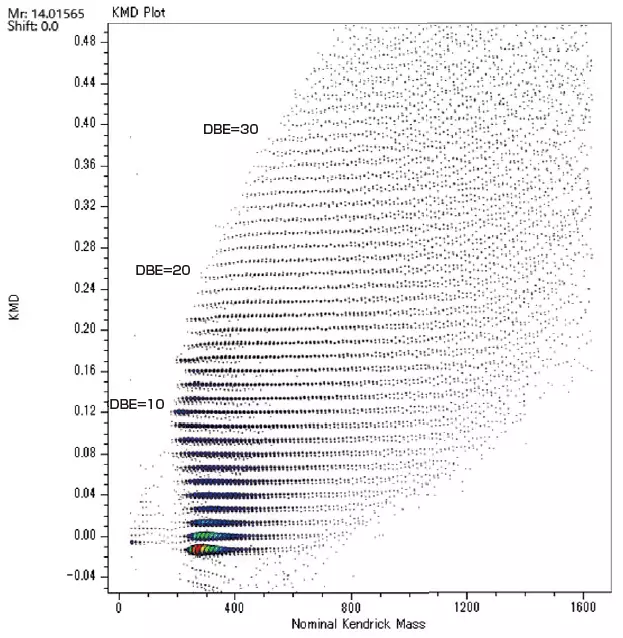
Image Credit: JEOL USA, Inc.
Source: JEOL USA, Inc.
Remarks
- Peak list input format: m/z and ion intensity.
- The accuracy of the submitted peak lists determines the effectiveness of the processed findings.
This program runs on Microsoft® Windows® 10 Pro (64-bit). MS-57071PCE or a comparable product is recommended for PC. Microsoft, Windows, PowerPoint, and Microsoft Office are registered trademarks of Microsoft Corporation in the United States and other countries. Microsoft Word is a product of Microsoft Corporation.
Functions
- KMR plots
- Remainder of KM (RKM) plots
- Estimated circles of homopolymer end groups (on KMR plots)
- Import peak lists (up to 10 lists at a time)
- Deisotope
- Display centroided (bar-graph) mass spectrum
- KMD plot
- Fraction base KMD plots
- Search polymer series:
- Find homopolymer series and compute polydispersity (mass/degree of polymerization) and average molecular weight (mass/degree of polymerization).
- Determine the molar/weight ratio of two monomers, search for binary copolymers, and create a DP (degree of polymerization) plot.
- Grouping:
- Finding the groupings' average molecular weight and polydispersity.
- Each group's relative ion intensity in relation to the total of all groups' ion intensities.
- Color-coded groups.
- Enable/disable display of polymer series groups.
- Elemental composition determination:
- Determine the elemental composition of monomers and end groups.
- Saving the history of elemental composition determination.
- Differential examination of two samples.
- Compound List Search, elemental composition search, and determining a single component’s elemental composition.
- Machine learning-based noise filtering (for data acquired with JMS-S3000).