The msFineAnalysis series is an automated qualitative analysis software that facilitates "integrated analysis" by combining library database (DB) searches using EI data with molecular weight confirmation from soft ionization data.
msFineAnalysis iQ is tailored for low-resolution integer mass data analysis, while msFineAnalysis AI is designed for high-resolution exact mass data analysis. Both packages enhance analysis accuracy, reduce processing time, and increase work efficiency.
The msFineAnalysis iQ is perfect for single quad and triple quad mass specs, while msFineAnalysis AI works with the AccuTOF GC-Alpha.
Usefulness of Integrated Qualitative Analysis
In qualitative analysis by GC-MS, library database (DB) searches are typically performed using mass spectra obtained via Electron Ionization (EI).
The following figures and table present component A's EI and Soft Ionization (SI) mass spectra, along with the library DB search results based on the EI spectrum. Multiple candidates were obtained by the search, with similarity scores exceeding 800.
Component A is usually identified as the top candidate with the highest similarity score when relying solely on the EI spectrum. However, the detection of m/z 314 (the assumed molecular ion) in the SI spectrum suggests that component A is more accurately identified as the second candidate, "Diethylene glycol dibenzoate."
At JEOL, the combination of library database searches using EI mass spectra and molecular ion analysis from SI mass spectra is called "integrated qualitative analysis." The msFineAnalysis series software is designed to perform this integrated qualitative analysis automatically.
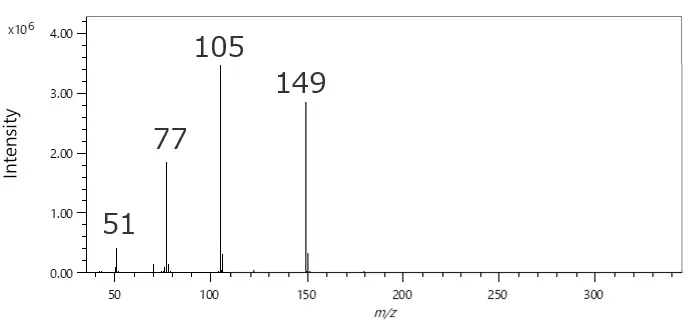
EI mass spectrum of component A. Image Credit: JEOL USA, Inc.
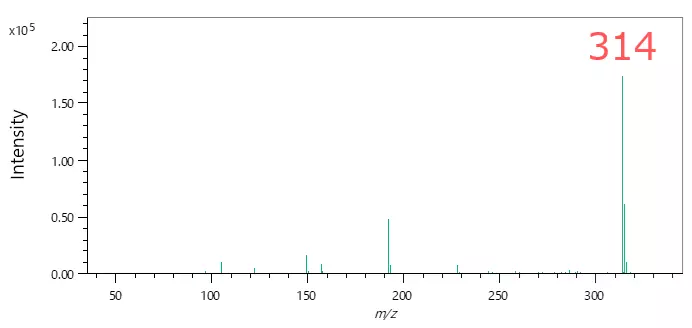
SI mass spectrum of component A. Image Credit: JEOL USA, Inc.
The library DB search results of component A (Top 5 candidates). Source: JEOL USA, Inc.
| No. |
Library Name |
Similarity |
Formula |
MW |
| 1 |
2,2'-(Ethane-1,2-diylbis(oxy))bis(ethane-2,1-diyl) dibenzoate |
828 |
C20 H22 O6 |
358 |
| 2 |
Diethylene glycol dibenzoate |
821 |
C18 H18 O5 |
314 |
| 3 |
Benzoic acid, 2-(3-nitrophenyl)ethyl ester |
810 |
C15 H13 N O4 |
271 |
| 4 |
1,3-Dioxolane, 2-(methoxymethyl)-2-phenyl- |
802 |
C11 H14 O3 |
194 |
| 5 |
3,6,9,12-Tetraoxatetradecane-1,14-diyl dibenzoate |
800 |
C24 H30 O8 |
446 |
GC-MS Qualitative Analysis Solution
Problems in Conventional Qualitative Analysis
- Library database search results often yield multiple similar candidates, rather than a single definitive match.
- Compounds that are not included in the library cannot be identified through database searches.
- The more advanced an analysis is, the more time it requires to process.
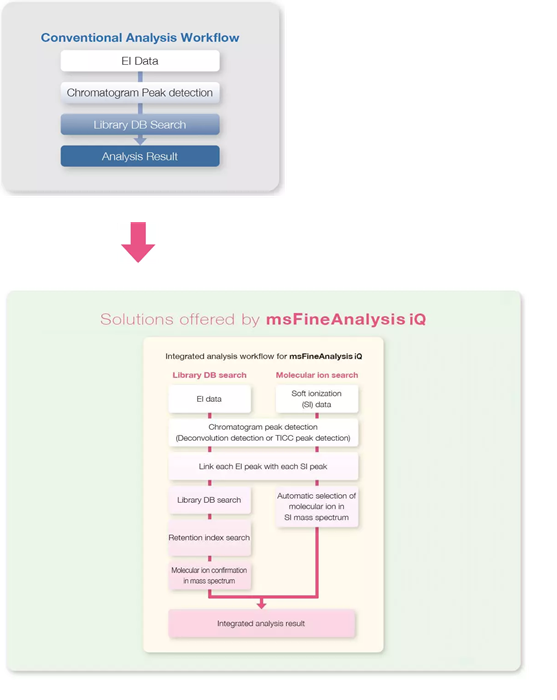
Image Credit: JEOL USA, Inc.
- Integrated analysis combining EI and soft ionization (SI) data quickly narrows down candidate compounds.
- Having selected data, an automatic integrated report can be generated in a single click.
Integrated Analysis Result Window
The Integrated Analysis Result window allows users to review combined analysis outcomes. It can display EI and SI chromatograms, chromatogram details, spectrum information, library database search results, and molecular ion analysis data.
A separate mass spectrum analysis window opens when the user double-clicks a line in the analysis result list, allowing them to verify the search and molecular ion analysis results. Users can also update results or rerun analyses from this window.
Additionally, msFineAnalysis, which supports exact mass data analysis, can propose the correct molecular formula for components absent from the library database and provide partial structural information derived from the EI data.
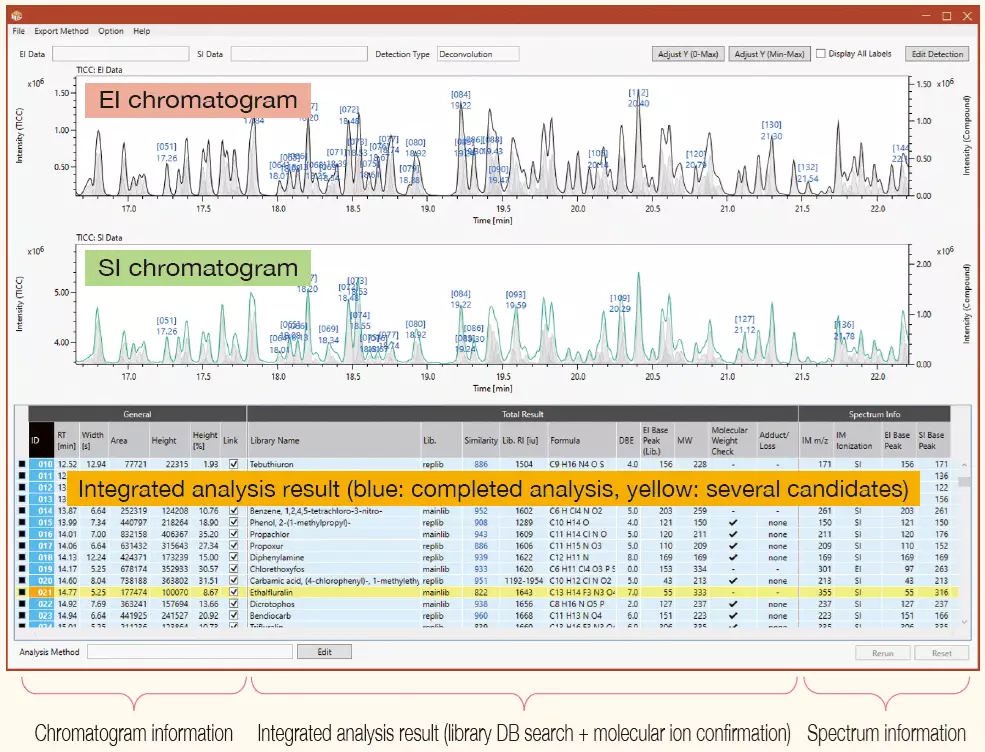
Image Credit: JEOL USA, Inc.
Complete Functionality of msFineAnalysis iQ
Two-Sample Comparison Function (Differential Analysis)
The two-sample comparison function shows reproducibility of the p-value on the vertical axis, with a volcano plot showing the intensity ratio between two samples on the horizontal axis.
Visual representation of the data enables quick identification of changes, such as increased or decreased components in a defective product relative to a reference or unique compounds in a new material compared to an existing one.
After performing differential analysis between samples, the standard msFineAnalysis integrated analysis is applied to all components. The two-sample comparison function allows setting the number of measurements per sample to n=1, 3, or 5. While statistical reproducibility cannot be assessed when n=1, component differences can still be detected, making the function suitable even for limited sample sets.
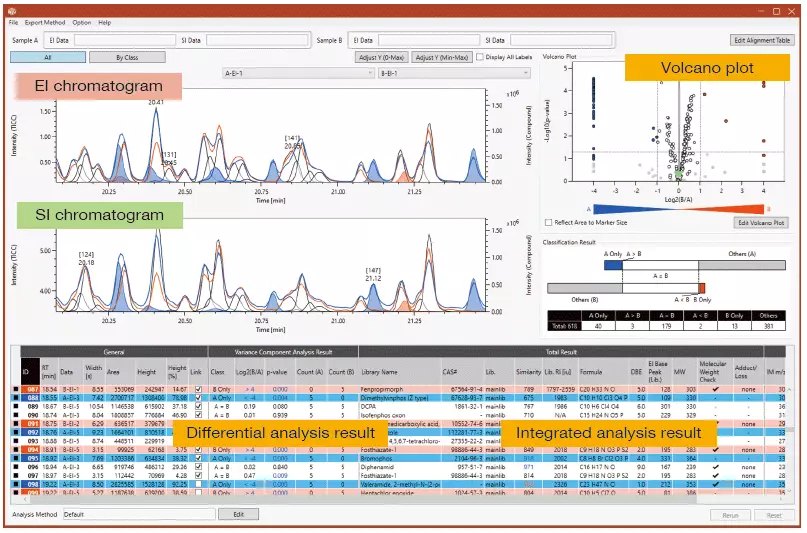
Image Credit: JEOL USA, Inc.
Deconvolution Detection
Deconvolution detection can uncover trace components obscured in the TICC due to overlapping or coeluting peaks. This removes the need to manually create extracted ion chromatograms for each target component.
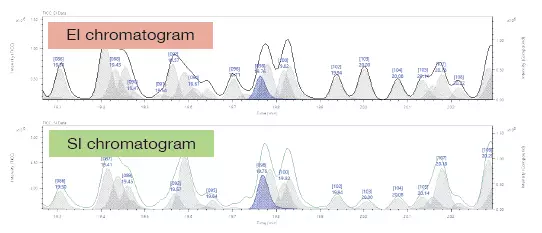
EI: black solid line: TICC, gray peaks: deconvolution peak (blue: currently selected). SI: green solid line: TICC, gray peaks: deconvolution peak (blue: currently selected). Image Credit: JEOL USA, Inc.
Retention Index Qualitative Analysis
Retention index (RI) is a relative value based on the retention time (RT) of an n-alkane standard mixture. The qualitative analysis function converts a target component’s retention time into a retention index, which is then compared with database values.
With the msFineAnalysis series, incorporating RI allows for further refinement of qualitative analysis results.
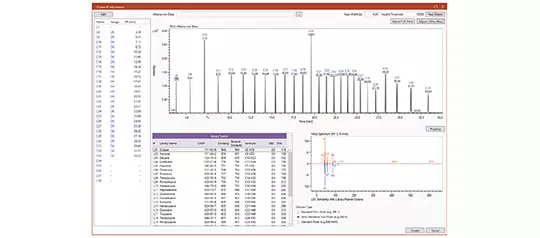
Retention index creation screen: GC/EI data of n-alkane mixture. Image Credit: JEOL USA, Inc.
Analysis by EI Data Alone
The msFineAnalysis iQ can also support analysis using only EI data. When soft ionization data is unavailable, the software can generate an integrated report by performing a library search and molecular ion identification using EI data.
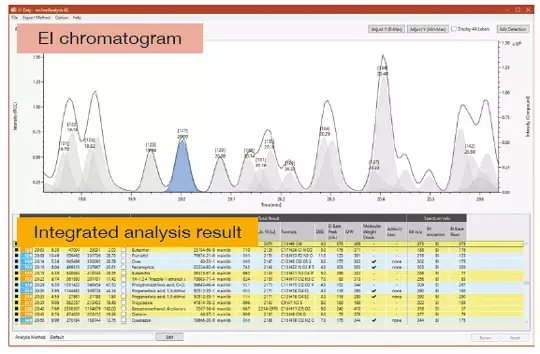
Image Credit: JEOL USA, Inc.
Applicable Models
msFineAnalysis iQ
- GC/Triple-Quadrupole Mass Spectrometer
- Single-Quadrupole Mass Spectrometer
Notes
msFine Analysis iQ
- The MS-06023N20 (NIST20 database) is required.
- This product runs on PCs with Windows® 10 (64-bit version) installed.
- A display monitor with a 1920 × 1080 pixels resolution or higher is required.
- A PC meeting or exceeding the specifications of the MS-67078PCJ is recommended.
- Only the following data types are supported:
- MS-66060MPR (Main Program):
- Scan data
- Scan data in SIM/Scan mode
- MS-66090MPR (Main Program):
- Scan data in single Q mode
- Scan data in single Q/SIM/Scan mode
- Scan data in SRM/Scan mode