EDAX OIM Analysis™ is a powerful tool for visualizing and analyzing electron backscatter diffraction (EBSD) data. With as little as one click, see how this powerful tool can map large, multidimensional data sets or draw from the most comprehensive analysis portfolio to characterize challenging materials.
OIM Analysis provides new insight into material characteristics and makes EBSD analysis accessible to both novice and experienced users.
Get a Head Start on the Analysis with Quick-Gen
- With a single click, answer the most frequent queries using established analysis tools and templates.
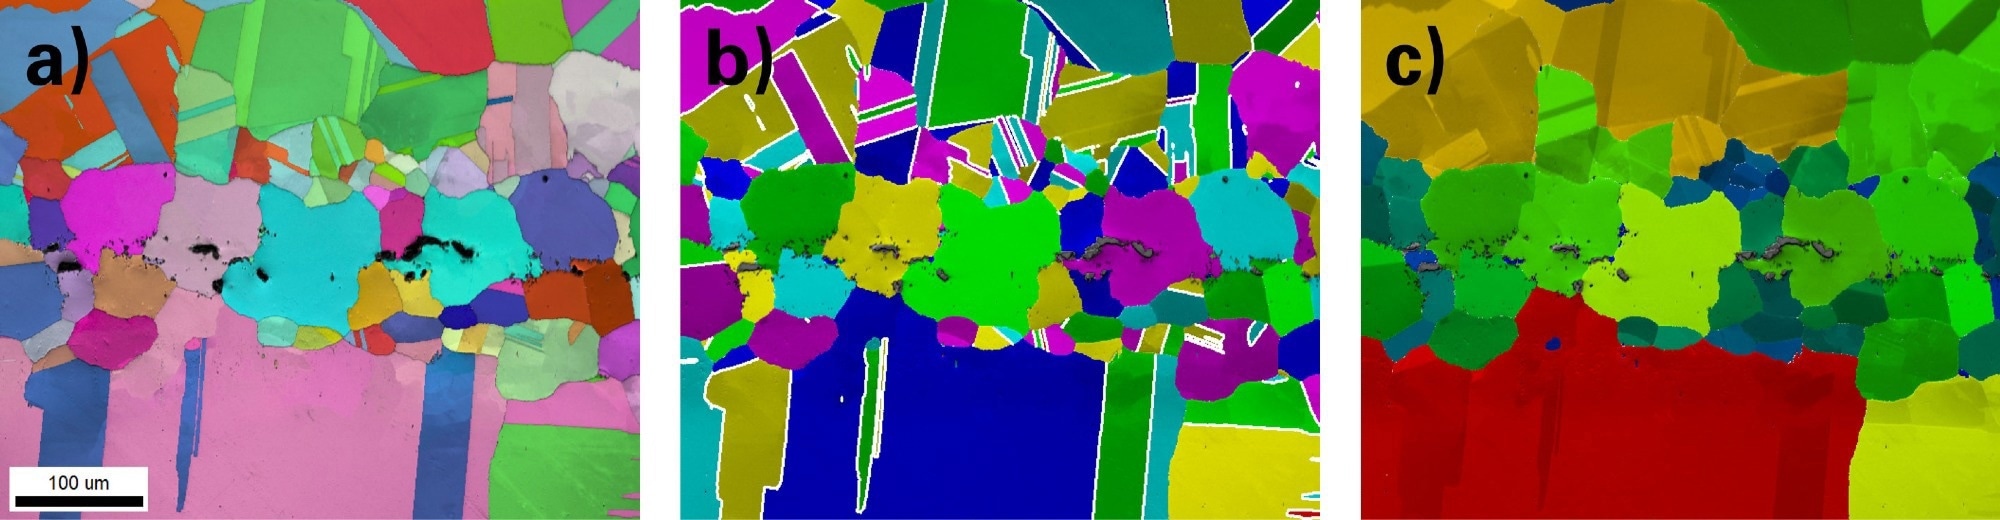
Figure 1. Customized maps showing a) EBSD image quality and IPF orientations, b) PRIAS and grain color maps with twin boundaries, and c) grain size maps after twin removal from a high entropy alloy brazing. Image Credit: Gatan, Inc.
- Convert the bespoke analyses into Quick-Gen templates with a single click for recurrent usage and to reduce the user’s response time.
- Reproducibly process large, multidimensional datasets or projects with batch processing templates to monitor microstructural changes across samples, time, or temperature.
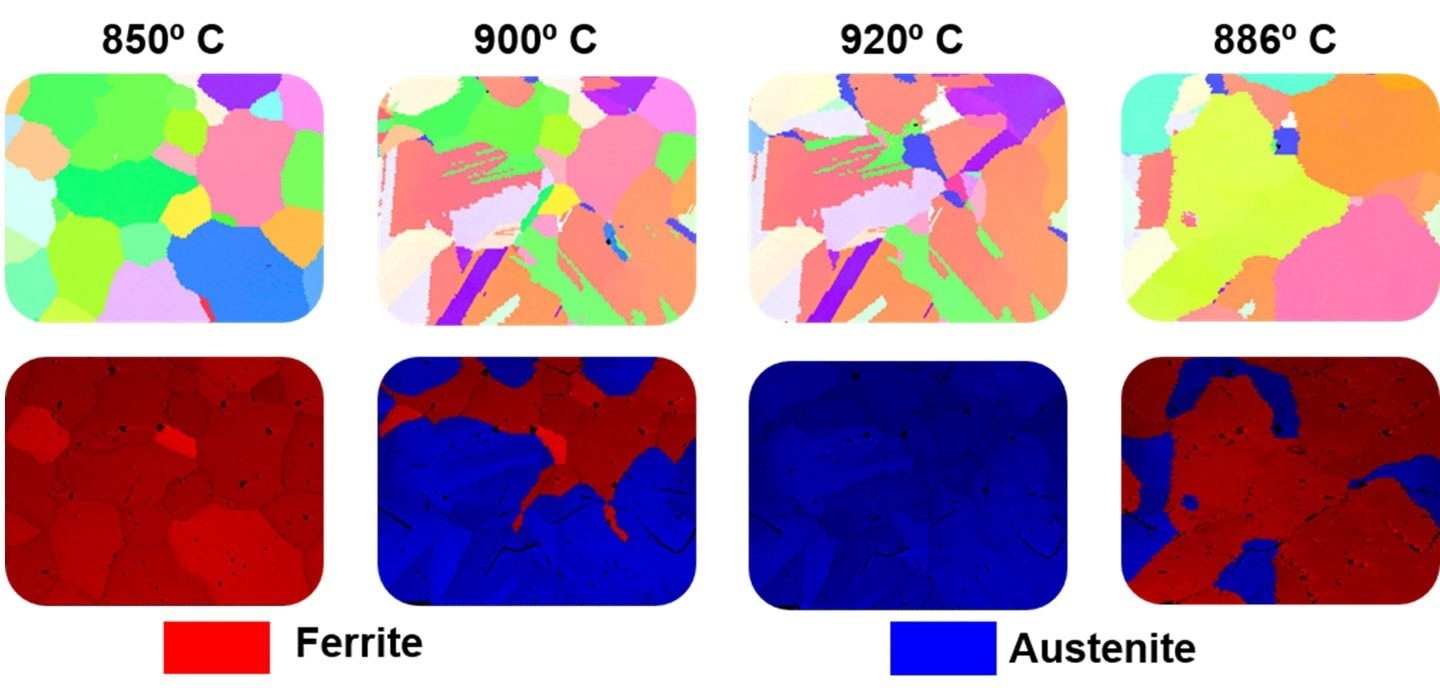
Figure 2. Orientation and phase maps showing the transitions between the BCC ferrite phase and the FCC austenite phase during in-situ heating. Image Credit: Gatan, Inc.
- Define partitions and highlight areas of interest to make it simple to distinguish and detect microstructural changes in the data.
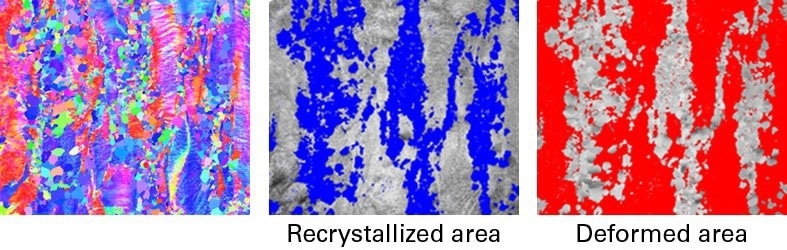
Figure 3. In this partially recrystallized steel sample, the deformed and recrystallized areas can be identified and analyzed individually to better understand recrystallization behavior. Image Credit: Gatan, Inc.
All the Tools Users Need to Understand Their Samples
- Visualize deformed microstructures with clarity at less than 0.01° resolution to increase orientation accuracy and lower noise in maps based on misorientation.
- Provide all EDAX systems the ability to obtain orientation results that are on par with or better than HR-EBSD 100 times quicker.
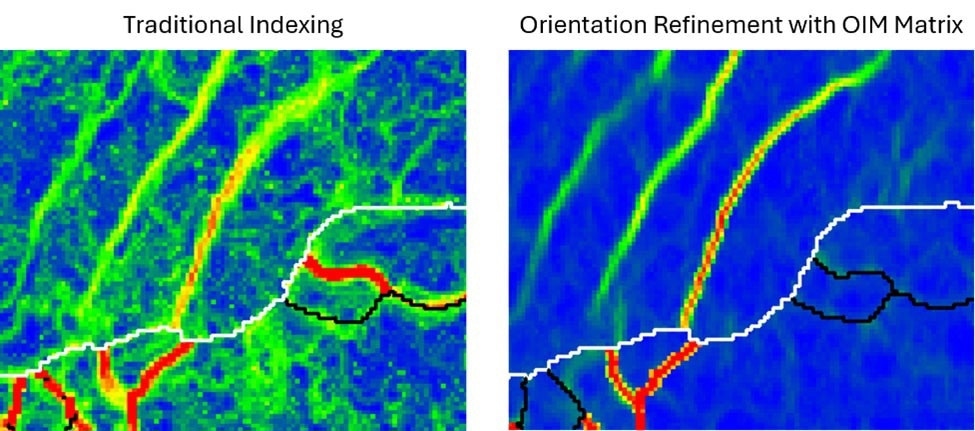
Figure 4. OIM Matrix improves orientation precision and removes noise in the KAM map from an additively manufactured 316L alloy. Image Credit: Gatan, Inc.
- Utilize interactive plots and maps to analyze, connect, display, and quantify data to identify important contributors or anomalies in the microstructures.
- Determine and measure directional misorientations within discrete regions of interest with accuracy.
- By employing ChI-Scan™ to concurrently evaluate the EDS and EBSD data, users can eliminate uncertainty and error in multiphase samples.
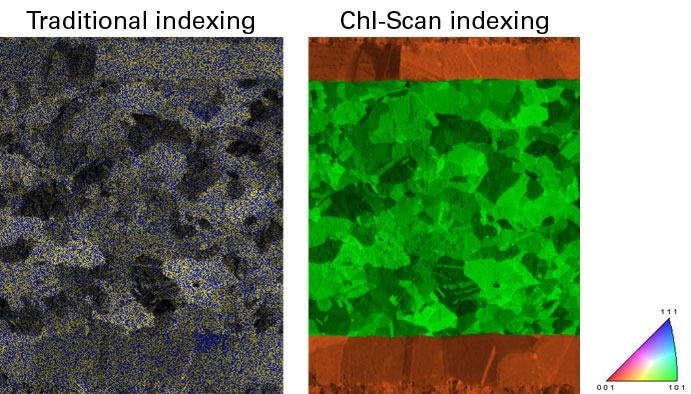
Figure 5. Phase maps showing how ChI-Scan can use combined EDS and EBSD information to eliminate the ambiguities between similar crystallographic structures and show clear phase maps. Phase map before (left) and after (right) ChI-Scan analysis. The green phase is Kovar (FeNiCo) and the orange phase is copper, both with FCC crystal structures. Image Credit: Gatan, Inc.
Unique Solutions to Any Problem
- Improve EBSD pattern indexing by combining spherical indexing with NPAR, transforming previously useless patterns into quantifiable results.
- Use the most comprehensive toolbox to analyze challenging samples using innovative methods like spherical indexing, PRIAS, and NPAR.
- Using dynamic diffraction-based pattern simulations, identify the minute variations amongst similar crystal structures.
- With PRIAS imaging, users can see more of the sample since it automatically gives topographic contrasts, atomic numbers, and orientation without further hardware.
Figure 6. PRIAS maps show phase, orientation, and topographic contrasts that are not typically observed with standard SEM detectors with EBSD sample geometries. Image Credit: Gatan, Inc.