EDAX’s premier software program APEX™ is designed for the collection and investigation of Energy Dispersive Spectroscopy (EDS) data and compositional material characterization. Thanks to its user-friendly interface, concurrent review mode analysis, and real-time graphical display, APEX guarantees superior quality, precise results, and enhanced productivity.

Image Credit: EDAX
Ease of Use
- Intuitive operation for beginner and expert users
- Obtain and report data at the click of a mouse
- Standard operations are automated for fast and easy analysis
- Login based on profile guarantees that everyone has the proper level of access, from individual users to administrators
Customization
- A color scheme that users can select from to suit the Scanning Electron Microscope (SEM) interface or user preferences
- Display configuration options present data based on user preferences
- Resize and organize data windows based on user requirements
Features
Simultaneous Live and Review Mode
Enhance the efficiency of an experiment by concurrently gathering a linescan, spectrum, or map while users can assess data and produce reports.
Real-Time Results
- Instantly identify and show elements using Element ID
- Dynamically edit elements for the most precise and efficient examination
- Dynamically edit elements for the most precise and efficient examination
Smart Quant
- Concurrently carry out quantitative analysis during spectral data collection without any delay in the acquisition
- ZAF-corrected spectral analysis can be used for quantitative compositional information


Graphical representation and statistical analysis of quantification results. Image Credit: EDAX
Full Standards Quant
- Flexibility to search, select, and merge standards
- SmartStandards mode for intelligent selection of appropriate standards for precise quantification results
Multipoint Analysis
- Employ Survey mode to carry out point sampling quickly
- Mark and examine several locations on a sample to enhance the efficiency of data collection
- Multipoint scan lists can be saved and recalled to automate data collection and examination
Data Management and Reporting
- Project tree storage for smooth management of all data
- Project exports to *.hdf file format
- Single click saving of windows as *.bmp, *.jpg, *.png, or *.tif images
Advanced Reporting
- Combines several templates to display results effortlessly
- Use Report Designer to modify presentation templates for images, logos, quantification results, text, spectra, and sample information
- Data can be easily compared from several areas or samples in the same report
- Directly create reports from the APEX Live mode to reduce time to results
- Reports can be automatically and immediately created after data collection is done

Reports toolbar. Image Credit: EDAX
EDS Mapping
- Counts per second (CPS) map displays count rate quality at every pixel presented to offer a CPS distribution and highlights differences caused by surface features
- CompoMaps separate contributions from overlapping peaks to individual elemental maps for more precise representations of EDS maps
- Users can choose from 40 color options to easily develop vibrant images during elemental mapping
- Users can quickly activate and incorporate elements while mapping to streamline operation and inspection
- Concurrently map numerous element lines (K, L, M)

CompoMap shows separated P K and Zr L overlapping peaks. Image Credit: EDAX
Dynamic Element Mapping
- Users can interact in real-time to exhibit only the elements while in Linescan and Mapping modes
- Elements, element lines, and user-selected regions of interest can be edited during map collection

Dynamic Element Mapping window. Image Credit: EDAX
Montage Large Area Mapping
- Large areas can be scanned using stage movements to gather several fields of analysis
- Data stitching can be automatically performed into a single file for detailed analysis
Smart Phase Mapping
- User setup is not required
- Elemental, spectra, and phase maps can be automatically collected
- The name and color selection of phases can be customized
- Phases can be predefined or reanalyzed based on spectra

Smart Phase Mapping. Image Credit: EDAX
Dual Detectors
- Minimizes shadowing and topographic artifacts
- Option to combine spectra/compositional maps from both detectors
- Averages quantitative analysis from two detectors to build more precise results
- Greater resolution stability versus systems with one detector with a large sensor
- Doubles throughput count rate while sustaining single detector energy resolution
Enhanced Linescan Acquisition
- Real-time overlay and scaling of the Linescan chart facilitates easy correlation of compositional data with image features
- Spectra collection can be configured for the efficient examination of compositional gradients
- Samples errors can be avoided when users use Linescan with drift correction in the APEX Advanced software package

Advanced Linescan function. Image Credit: EDAX
Live Drift Correction
- Drift parameters can be automatically set for easy operation
- The correction frequency can be dynamically adjusted based on the drift magnitude for strong correction performance
- Advanced correction options are available to record drift images and outline manual reference area
- Linescan, Spectrum, and Mapping are available modes for quality data in all collection modes
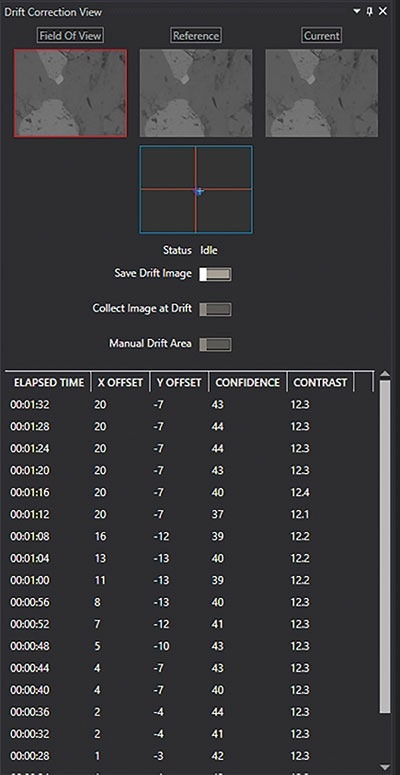
Drift Correction view panel. Image Credit: EDAX
Spectrum Match
- Users can create and use unique spectrum library for Spectrum Match
- The optional feature enables users to search a spectrum library to locate similar spectra
- A collected “unknown” spectrum can be matched to a library of reference spectra using the Smart Materials and Minerals Library option
- Streamlines identification of unknowns by comparing them to possible candidates and reduces the complexity of detecting inconsistencies and similarities between spectra